PROTECTED SOURCE SCRIPT
SR Strength
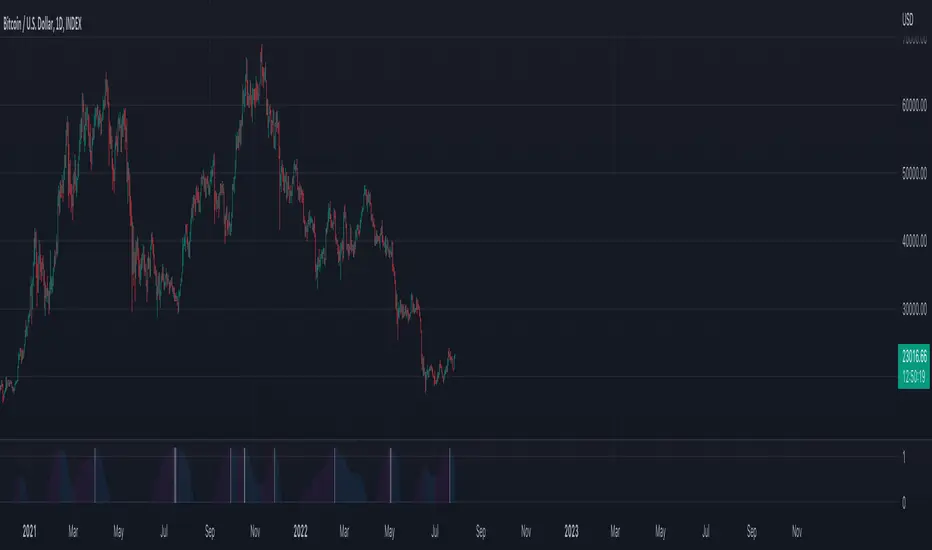
This indicator measures the strength of support and resistance. Purple bars show SR is increasing. Blue bars show SR strength is decreasing. White bars show the peak of SR strength. The threshold of the white bars can be adjusted in the settings. These extremes happen before a boom. This indicator is also very useful for picking up reversals. Sensitivity can be adjusted to 20 or 50 to find smaller booms and pushed all the way to 1000 or more to find stronger booms.
نص برمجي محمي
تم نشر هذا النص البرمجي كمصدر مغلق. ومع ذلك، يمكنك استخدامه بحرية ودون أي قيود - تعرف على المزيد هنا.
إخلاء المسؤولية
لا يُقصد بالمعلومات والمنشورات أن تكون، أو تشكل، أي نصيحة مالية أو استثمارية أو تجارية أو أنواع أخرى من النصائح أو التوصيات المقدمة أو المعتمدة من TradingView. اقرأ المزيد في شروط الاستخدام.