PROTECTED SOURCE SCRIPT
تم تحديثه NQ Market DNA: ML Scorer
NQ Market DNA: ML Scorer — Indicator Description
NQ Market DNA: ML Scorer is a session-structure and machine-learning scoring tool designed specifically for Nasdaq futures (NQ/MNQ). It converts the market’s overnight behavior into a single, probability-style score (0–100%) and a clear directional bias for the upcoming New York session.
This script is not a generic “trend indicator.” It is a rules-based implementation of a machine-learning model whose feature set and weightings were built and calibrated in Python using historical session data. The Pine Script version is the real-time execution layer: it measures the live session structure, applies the model weights, and displays the result on-chart.
________________________________________
What the indicator plots
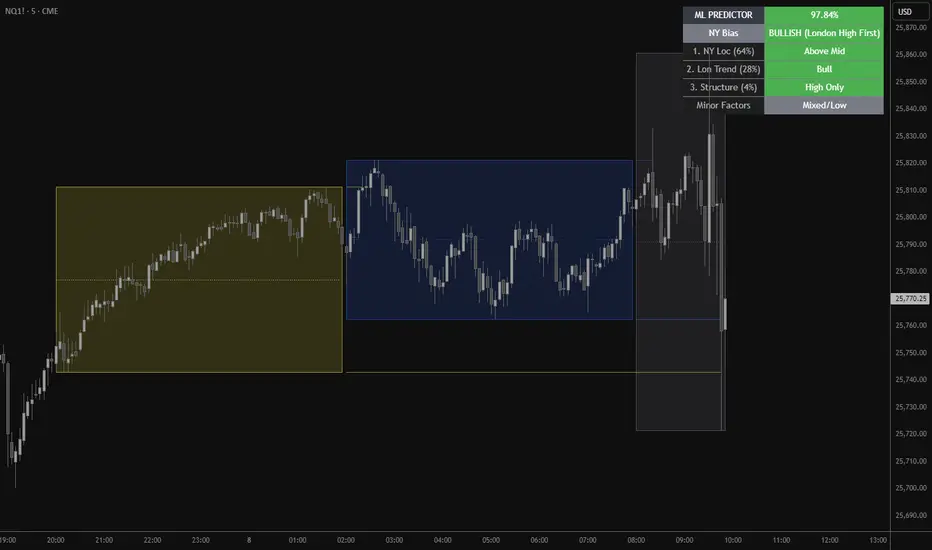
1) Session Boxes (Structure Map)
The indicator draws three session ranges using boxes and a midline:
• Asia Session (20:00–02:00 NY time by default)
• London Session (02:00–08:00 NY time by default)
• New York Session (08:00–16:00 NY time by default)
Each session box:
• Expands in real time as highs/lows develop
• Includes a dotted midline (session midpoint)
• “Locks” its final values once the session ends
2) Extension Levels (Target Interaction)
When Asia or London ends, the script projects high and low extension lines forward into the day. These lines extend until one of the following happens:
• Price trades back through the level (a touch/cross condition), or
• The script reaches the hard stop at 16:00 (end of NY session)
This makes it easy to visually track whether later sessions respect or invalidate prior-session extremes.
________________________________________
The ML scoring concept
Output: “Probability of High First” (0–100%)
The model’s output is a normalized score intended to behave like a probability. Practically:
• Score ≥ 50% → Bullish bias (“London High First”)
• Score < 50% → Bearish bias (“London Low First”)
The score is produced by summing weighted session features. If a feature is bullish, it contributes its weight; if bearish, it contributes zero. The weights approximately sum to ~100, so the final score naturally maps into a 0–100 range.
Bias coloring
The on-chart score cell uses a risk-style color gradient:
• Strong Bullish (typically > 75): green
• Neutral / mixed (around 40–75): orange
• Bearish / weak (below ~40): red
________________________________________
Features used by the model (and why they matter)
The ML scorer is driven by session positioning, trend, and volatility. Your Python research determined the relative importance of each feature; the largest weights reflect the strongest historical explanatory power.
Primary drivers (most important)
1. NY Open Location (Weight ~63.73%)
Checks whether the NY session opens above or below the London midpoint.
This is treated as the dominant structural signal because it captures whether NY is opening in the “upper half” or “lower half” of London’s range.
2. London Trend (Weight ~28.09%)
London close vs London open (bullish if close > open).
This represents whether London printed a directional push versus chop.
3. London Outcome / Structure (Weight ~4.21%)
Classifies London relative to Asia:
o “High-only sweep” (bullish structure) if London breaks Asia high without breaking Asia low
This is a proxy for one-sided liquidity behavior rather than symmetric volatility.
Minor factors (smaller weights, but still additive)
4. London Volatility (Weight ~1.11%)
London range relative to its own rolling average (lookback-controlled).
Used as a contextual amplifier: higher-than-normal London range can support continuation.
5. Asia Volatility (Weight ~1.05%)
Asia range relative to its rolling average.
Helps distinguish “quiet overnight” vs “expanded overnight,” which can change the day’s tendency.
6. Asia Trend (Weight ~1.00%)
Asia close vs Asia open.
A light directional context input.
7. London Open Location vs Asia Mid (Weight ~0.81%)
Whether London opens above/below the Asia midpoint.
Helps quantify early handoff positioning.
________________________________________
How to read the table
The table is designed to be a compact decision panel:
• ML PREDICTOR: the score (%) for the current day once NY has opened
• NY Bias: bullish or bearish interpretation based on the 50 threshold
• Top Drivers: shows the state of the highest-weighted features (NY location, London trend, structure)
• Minor Factors: a condensed read on volatility context (e.g., “High Vol” vs “Mixed/Low”)
This layout lets you quickly understand not only the bias, but what caused it.
________________________________________
Best-practice usage notes
• This tool is intended to be used as a context engine, not a standalone entry signal.
• It is most effective when combined with your execution framework (levels, risk model, confirmations, etc.).
• Because it relies on session boundaries, chart symbol and market hours must match the intended instrument (NQ futures) for the cleanest behavior.
________________________________________
Critical disclaimer and settings warning
IMPORTANT — DO NOT CHANGE SETTINGS.
This indicator’s machine-learning weights and feature calibration were derived in Python from historical data under a specific configuration (session windows, timezone, and feature definitions). Changing any inputs—especially session times, timezone, rolling windows, or ML feature weights—can materially invalidate the model’s expected behavior and may produce misleading outputs.
Use with caution.
This script is provided for educational and informational purposes only and does not constitute financial advice. Futures trading involves substantial risk and is not suitable for all traders. Past performance and historical patterns do not guarantee future results. You are solely responsible for any trading decisions and risk management.
If you ever re-train or re-calibrate the model in Python, update the weights only by replacing them with the new Python-derived values as a complete set—do not “tune” them manually.
NQ Market DNA: ML Scorer is a session-structure and machine-learning scoring tool designed specifically for Nasdaq futures (NQ/MNQ). It converts the market’s overnight behavior into a single, probability-style score (0–100%) and a clear directional bias for the upcoming New York session.
This script is not a generic “trend indicator.” It is a rules-based implementation of a machine-learning model whose feature set and weightings were built and calibrated in Python using historical session data. The Pine Script version is the real-time execution layer: it measures the live session structure, applies the model weights, and displays the result on-chart.
________________________________________
What the indicator plots
1) Session Boxes (Structure Map)
The indicator draws three session ranges using boxes and a midline:
• Asia Session (20:00–02:00 NY time by default)
• London Session (02:00–08:00 NY time by default)
• New York Session (08:00–16:00 NY time by default)
Each session box:
• Expands in real time as highs/lows develop
• Includes a dotted midline (session midpoint)
• “Locks” its final values once the session ends
2) Extension Levels (Target Interaction)
When Asia or London ends, the script projects high and low extension lines forward into the day. These lines extend until one of the following happens:
• Price trades back through the level (a touch/cross condition), or
• The script reaches the hard stop at 16:00 (end of NY session)
This makes it easy to visually track whether later sessions respect or invalidate prior-session extremes.
________________________________________
The ML scoring concept
Output: “Probability of High First” (0–100%)
The model’s output is a normalized score intended to behave like a probability. Practically:
• Score ≥ 50% → Bullish bias (“London High First”)
• Score < 50% → Bearish bias (“London Low First”)
The score is produced by summing weighted session features. If a feature is bullish, it contributes its weight; if bearish, it contributes zero. The weights approximately sum to ~100, so the final score naturally maps into a 0–100 range.
Bias coloring
The on-chart score cell uses a risk-style color gradient:
• Strong Bullish (typically > 75): green
• Neutral / mixed (around 40–75): orange
• Bearish / weak (below ~40): red
________________________________________
Features used by the model (and why they matter)
The ML scorer is driven by session positioning, trend, and volatility. Your Python research determined the relative importance of each feature; the largest weights reflect the strongest historical explanatory power.
Primary drivers (most important)
1. NY Open Location (Weight ~63.73%)
Checks whether the NY session opens above or below the London midpoint.
This is treated as the dominant structural signal because it captures whether NY is opening in the “upper half” or “lower half” of London’s range.
2. London Trend (Weight ~28.09%)
London close vs London open (bullish if close > open).
This represents whether London printed a directional push versus chop.
3. London Outcome / Structure (Weight ~4.21%)
Classifies London relative to Asia:
o “High-only sweep” (bullish structure) if London breaks Asia high without breaking Asia low
This is a proxy for one-sided liquidity behavior rather than symmetric volatility.
Minor factors (smaller weights, but still additive)
4. London Volatility (Weight ~1.11%)
London range relative to its own rolling average (lookback-controlled).
Used as a contextual amplifier: higher-than-normal London range can support continuation.
5. Asia Volatility (Weight ~1.05%)
Asia range relative to its rolling average.
Helps distinguish “quiet overnight” vs “expanded overnight,” which can change the day’s tendency.
6. Asia Trend (Weight ~1.00%)
Asia close vs Asia open.
A light directional context input.
7. London Open Location vs Asia Mid (Weight ~0.81%)
Whether London opens above/below the Asia midpoint.
Helps quantify early handoff positioning.
________________________________________
How to read the table
The table is designed to be a compact decision panel:
• ML PREDICTOR: the score (%) for the current day once NY has opened
• NY Bias: bullish or bearish interpretation based on the 50 threshold
• Top Drivers: shows the state of the highest-weighted features (NY location, London trend, structure)
• Minor Factors: a condensed read on volatility context (e.g., “High Vol” vs “Mixed/Low”)
This layout lets you quickly understand not only the bias, but what caused it.
________________________________________
Best-practice usage notes
• This tool is intended to be used as a context engine, not a standalone entry signal.
• It is most effective when combined with your execution framework (levels, risk model, confirmations, etc.).
• Because it relies on session boundaries, chart symbol and market hours must match the intended instrument (NQ futures) for the cleanest behavior.
________________________________________
Critical disclaimer and settings warning
IMPORTANT — DO NOT CHANGE SETTINGS.
This indicator’s machine-learning weights and feature calibration were derived in Python from historical data under a specific configuration (session windows, timezone, and feature definitions). Changing any inputs—especially session times, timezone, rolling windows, or ML feature weights—can materially invalidate the model’s expected behavior and may produce misleading outputs.
Use with caution.
This script is provided for educational and informational purposes only and does not constitute financial advice. Futures trading involves substantial risk and is not suitable for all traders. Past performance and historical patterns do not guarantee future results. You are solely responsible for any trading decisions and risk management.
If you ever re-train or re-calibrate the model in Python, update the weights only by replacing them with the new Python-derived values as a complete set—do not “tune” them manually.
ملاحظات الأخبار
Updated Indicator Chart Viewنص برمجي محمي
تم نشر هذا النص البرمجي كمصدر مغلق. ومع ذلك، يمكنك استخدامه بحرية ودون أي قيود - تعرف على المزيد هنا.
إخلاء المسؤولية
لا يُقصد بالمعلومات والمنشورات أن تكون، أو تشكل، أي نصيحة مالية أو استثمارية أو تجارية أو أنواع أخرى من النصائح أو التوصيات المقدمة أو المعتمدة من TradingView. اقرأ المزيد في شروط الاستخدام.
نص برمجي محمي
تم نشر هذا النص البرمجي كمصدر مغلق. ومع ذلك، يمكنك استخدامه بحرية ودون أي قيود - تعرف على المزيد هنا.
إخلاء المسؤولية
لا يُقصد بالمعلومات والمنشورات أن تكون، أو تشكل، أي نصيحة مالية أو استثمارية أو تجارية أو أنواع أخرى من النصائح أو التوصيات المقدمة أو المعتمدة من TradingView. اقرأ المزيد في شروط الاستخدام.