PROTECTED SOURCE SCRIPT
تم تحديثه Cloud Craft SR [Volume Enhanced Edition]
Cloud Craft SR [Volume Enhanced] - Advanced Support & Resistance System
Short Description:
Advanced cloud-based support & resistance indicator with volume analysis. Features dynamic zones, multi-timeframe analysis, and adaptive visual themes for different chart backgrounds.
Full Description:
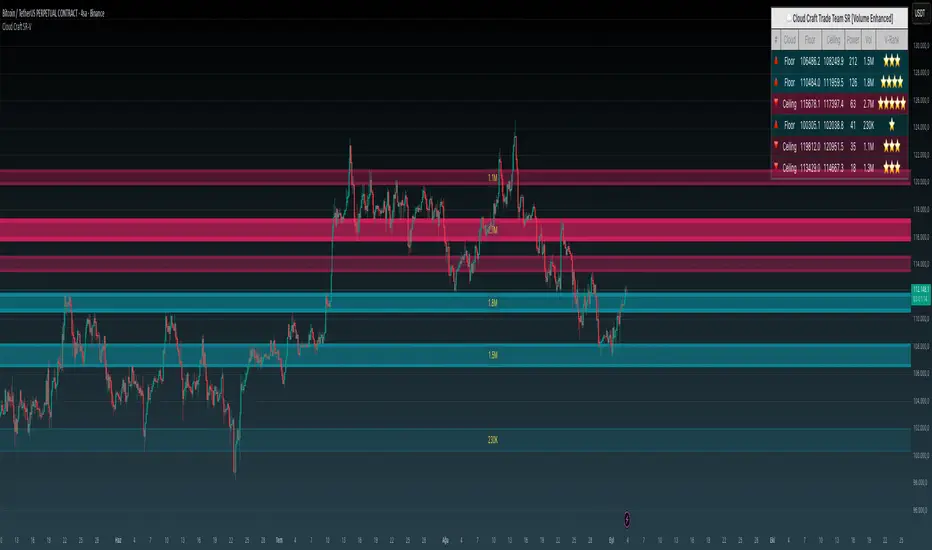
Cloud Craft SR [Volume Enhanced] is an advanced support and resistance detection system that combines price action analysis with volume dynamics to identify high-probability trading zones.
🎯 Key Features:
Smart Zone Detection: Automatically identifies and ranks support/resistance zones based on historical price action
Volume Integration: Enhanced zone strength calculation using volume-weighted analysis
Multi-Timeframe Analysis: Configurable timeframe selection for deeper market structure analysis
Adaptive Visual Themes: Three color schemes optimized for white, black, and gray chart backgrounds
Dynamic Cloud Visualization: Visual representation of zone strength through opacity and border width
Real-Time Information Panel: Live zone data with volume rankings and strength metrics
Breakout Detection: Volume-confirmed breakout signals for enhanced reliability
📊 How Power & Volume Are Calculated:
Power Calculation:
Power represents the strength of each support/resistance zone based on:
Pivot Points: Number of price reversals at the zone (each pivot = 20 base points)
Touch Count: How many times price has tested the zone
Volume Weight: If volume analysis is enabled, zones with higher volume get multiplied strength
Example:
Zone has 3 pivot points = 60 base points
Price touched the zone 5 times = +5 points
Total base strength = 65
If volume at this zone is 1.5x average = 65 × 1.5 = 97.5 Power
Display Power = 97.5 ÷ 10 = 9.8 (shown as 10 in panel)
Volume Integration:
Collects volume data at each pivot point
Compares zone volume to average volume
Applies multiplier (default 1.5x) to strengthen high-volume zones
Volume Rank shows relative volume importance (⭐ to ⭐⭐⭐⭐⭐)
Visual Representation:
Higher Power = Thicker borders
Higher Volume = Less transparency (more solid appearance)
Top zones are displayed with strongest at top of panel
⚙️ Customization Options:
Cloud Timeframe (3min to Monthly)
Analysis Depth (100-500 bars)
Zone Sensitivity Control (2-12%)
Strength Filter Settings (min touches required)
Visual Style Selection
Volume Analysis Toggle
Panel Position & Theme
📈 How It Works:
The indicator analyzes historical price pivots to identify areas where price has repeatedly found support or resistance. These zones are then weighted by volume activity to determine their relative strength. Stronger zones appear more prominent visually, helping traders quickly identify key levels.
💡 Best Use Cases:
Identifying key support/resistance levels for entry/exit points
Confirming breakouts with volume analysis
Setting stop-loss and take-profit levels
Multi-timeframe confluence analysis
Risk management and position sizing
Default Settings Optimized For: 4H timeframe analysis with 250-bar lookback period
Why Protected Source?
This indicator uses proprietary algorithms for:
- Advanced pivot detection with volume weighting
- Dynamic zone strength calculation combining multiple factors
- Adaptive visual rendering based on volume and strength metrics
Short Description:
Advanced cloud-based support & resistance indicator with volume analysis. Features dynamic zones, multi-timeframe analysis, and adaptive visual themes for different chart backgrounds.
Full Description:
Cloud Craft SR [Volume Enhanced] is an advanced support and resistance detection system that combines price action analysis with volume dynamics to identify high-probability trading zones.
🎯 Key Features:
Smart Zone Detection: Automatically identifies and ranks support/resistance zones based on historical price action
Volume Integration: Enhanced zone strength calculation using volume-weighted analysis
Multi-Timeframe Analysis: Configurable timeframe selection for deeper market structure analysis
Adaptive Visual Themes: Three color schemes optimized for white, black, and gray chart backgrounds
Dynamic Cloud Visualization: Visual representation of zone strength through opacity and border width
Real-Time Information Panel: Live zone data with volume rankings and strength metrics
Breakout Detection: Volume-confirmed breakout signals for enhanced reliability
📊 How Power & Volume Are Calculated:
Power Calculation:
Power represents the strength of each support/resistance zone based on:
Pivot Points: Number of price reversals at the zone (each pivot = 20 base points)
Touch Count: How many times price has tested the zone
Volume Weight: If volume analysis is enabled, zones with higher volume get multiplied strength
Example:
Zone has 3 pivot points = 60 base points
Price touched the zone 5 times = +5 points
Total base strength = 65
If volume at this zone is 1.5x average = 65 × 1.5 = 97.5 Power
Display Power = 97.5 ÷ 10 = 9.8 (shown as 10 in panel)
Volume Integration:
Collects volume data at each pivot point
Compares zone volume to average volume
Applies multiplier (default 1.5x) to strengthen high-volume zones
Volume Rank shows relative volume importance (⭐ to ⭐⭐⭐⭐⭐)
Visual Representation:
Higher Power = Thicker borders
Higher Volume = Less transparency (more solid appearance)
Top zones are displayed with strongest at top of panel
⚙️ Customization Options:
Cloud Timeframe (3min to Monthly)
Analysis Depth (100-500 bars)
Zone Sensitivity Control (2-12%)
Strength Filter Settings (min touches required)
Visual Style Selection
Volume Analysis Toggle
Panel Position & Theme
📈 How It Works:
The indicator analyzes historical price pivots to identify areas where price has repeatedly found support or resistance. These zones are then weighted by volume activity to determine their relative strength. Stronger zones appear more prominent visually, helping traders quickly identify key levels.
💡 Best Use Cases:
Identifying key support/resistance levels for entry/exit points
Confirming breakouts with volume analysis
Setting stop-loss and take-profit levels
Multi-timeframe confluence analysis
Risk management and position sizing
Default Settings Optimized For: 4H timeframe analysis with 250-bar lookback period
Why Protected Source?
This indicator uses proprietary algorithms for:
- Advanced pivot detection with volume weighting
- Dynamic zone strength calculation combining multiple factors
- Adaptive visual rendering based on volume and strength metrics
ملاحظات الأخبار
New Features:Added "Current" timeframe option - Now you can analyze zones using your active chart's timeframe instead of only higher timeframes
Fixed runtime errors - Resolved historical data access issues that caused "requested historical offset beyond buffer's limit" errors
Bug Fixes:
Touch count calculation improved - Fixed out-of-bounds errors by implementing safer lookback limits
Added safety checks
Boundary protection
نص برمجي محمي
تم نشر هذا النص البرمجي كمصدر مغلق. ومع ذلك، يمكنك استخدامه بحرية ودون أي قيود - تعرف على المزيد هنا.
Telegram : t.me/cloudcrafttrade
إخلاء المسؤولية
لا يُقصد بالمعلومات والمنشورات أن تكون، أو تشكل، أي نصيحة مالية أو استثمارية أو تجارية أو أنواع أخرى من النصائح أو التوصيات المقدمة أو المعتمدة من TradingView. اقرأ المزيد في شروط الاستخدام.