OPEN-SOURCE SCRIPT
تم تحديثه Relative Strength of a stock
Determine the relative strength of a stock vis-a-vis a larger benchmark. Default is NIFTY50.
ملاحظات الأخبار
Cosmetic changes to make the display pretty and input choices in more logical sequence.ملاحظات الأخبار
This version adds input as source type. So you can compare typical values, amongst other input values. Some cosmetic changes also naming of the plots etc.ملاحظات الأخبار
- Added colour coding of crossover RS
- Added label to mark reference date based on length input from the last bar
ملاحظات الأخبار
- Beautified the input dialog
- Added Support to plot trend on RS line
The trend on RS line is the arctan value of current bar to previous range (default 5 bars) back. If the radians is positive a green colour zero line is plotted else maroon is plotted.
ملاحظات الأخبار
- Pine script version 5
- NBC: Default length of SMA for RS changed to 50 from 61
- Added price-action indication for added confirmation along with RS, Provision to switch-off this completely from input dialog
Inputs for Price Confirmation
check box = Checked means enabled (default), uncheck to turn-off full feature
Period = Keep default value. Length on SMA for price confirmation.
Green color selector +ve = Bullish color and transparency selector
Red color selector -ve = Bearish color and transparency selector
=============================================================
Description of Price Confirmation behavior
=============================================================
In addition to the existing RS behavior, it is now possible to superimpose price-action behavior on the RS line.
As per existing RS, RS above zero indicates outperformance/strength over the selected benchmark and RS below zero indicates underperformance/weakness over the selected benchmark for the selected period.
Now, added a simple logic for price-action (check code for details)
If one uses price-action with RS, it is possible better manage the trade, time the entry and book partial profits or exit.
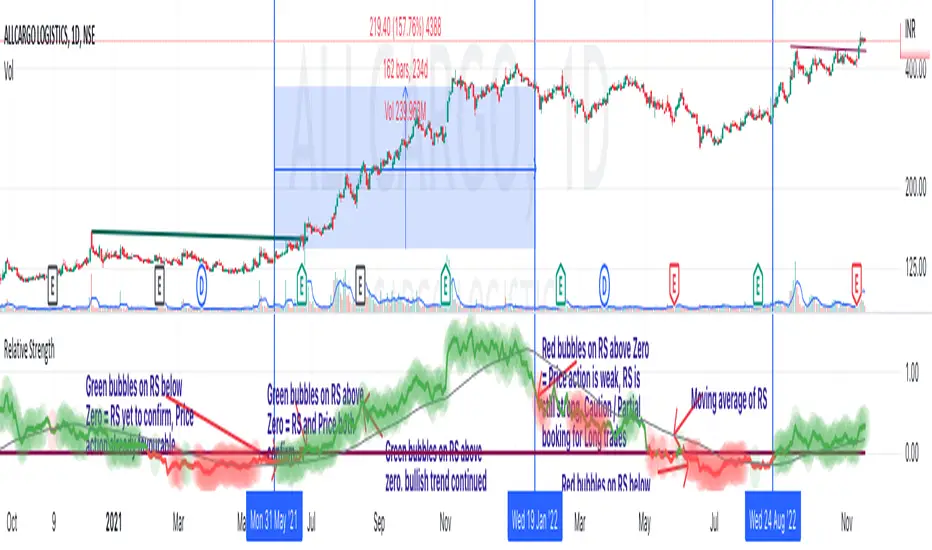
Price action is indicated by bubbles over the RS line. Green bubbles = Bullish Price Action. Red bubbles = Bearish Price Action.
When
RS is above zero and we have Green bubbles ==> Bullish trend in both price action and RS
RS is below zero and we have Red bubbles ==> Bearish trend in both price action and RS
RS is above zero and we have Red bubbles ==> Caution on the Bullish RS, ripe for profit booking, full exit or just caution.
RS is below zero and we have Green bubbles ==> Price indicating bullishness, RS yet to turn positive. Ripe for tracking position, partial entry, promotion in watchlist etc.
ملاحظات الأخبار
- Show trend color on RS MA
If the trend for moving average of RS is rising for 3 periods, plot in green. If falling for 3 periods, plot in red. Default is blue.
ملاحظات الأخبار
- Pine script update to version 6
- alertconditions for screener
نص برمجي مفتوح المصدر
بروح TradingView الحقيقية، قام مبتكر هذا النص البرمجي بجعله مفتوح المصدر، بحيث يمكن للمتداولين مراجعة وظائفه والتحقق منها. شكرا للمؤلف! بينما يمكنك استخدامه مجانًا، تذكر أن إعادة نشر الكود يخضع لقواعد الموقع الخاصة بنا.
إخلاء المسؤولية
لا يُقصد بالمعلومات والمنشورات أن تكون، أو تشكل، أي نصيحة مالية أو استثمارية أو تجارية أو أنواع أخرى من النصائح أو التوصيات المقدمة أو المعتمدة من TradingView. اقرأ المزيد في شروط الاستخدام.