PROTECTED SOURCE SCRIPT
STEPN CONVERSION OPTIMIZER

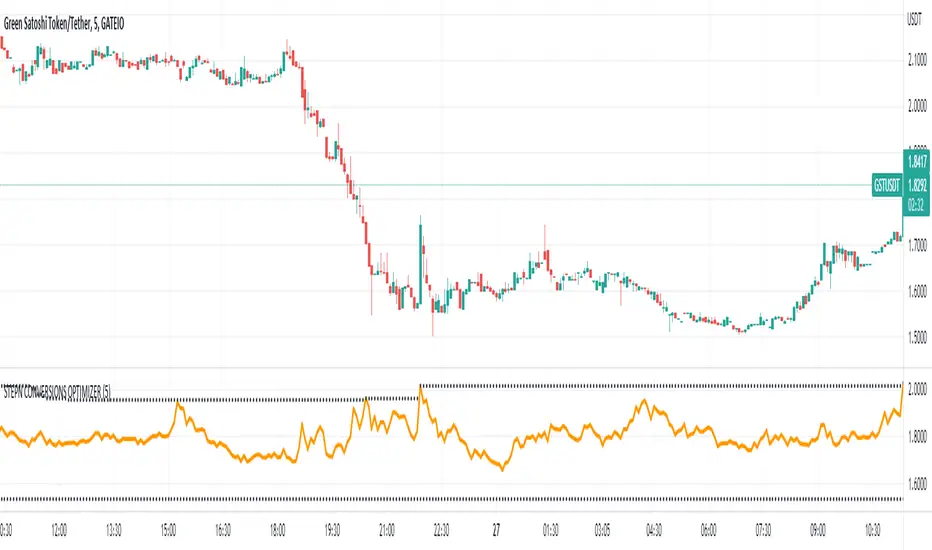
This is a very simple indicator that anyone can use but it is especially geared towards STEPN users who often have to switch between different tokens (GST, GMT, SOL, BNB).
The idea of the indicator is that at a glance you can know if it is a good time or not to make a conversion. What the indicator does is divide the value of the token that we have by the one that we want to change in each bar and with this data a graph is created with which you know how much you are going to receive for each token and how much you would have received at any other time.
It is completely configurable for any conversion between STEPN tokens, you can also include two dotted lines that indicate when the maximum and minimum conversion rate has been reached, which makes it very easy to know where you are.
The data collection is independent of the graph on screen so it's great to have it on screen waiting for the ideal moment for the change while you do other things.
The timeframe is also configurable in case you are not very interested in precision, by default the data is taken from the 5-minute chart.
I created this indicator for myself but seeing how useful it is to me and that not only am I not losing money like before but I am even earning money with conversions, I have decided to share it.
Feedback would be appreciated and if you like it and find it as useful as it does for me, show some love.
نص برمجي محمي
تم نشر هذا النص البرمجي كمصدر مغلق. ومع ذلك، يمكنك استخدامه بحرية ودون أي قيود - تعرف على المزيد هنا.
إخلاء المسؤولية
لا يُقصد بالمعلومات والمنشورات أن تكون، أو تشكل، أي نصيحة مالية أو استثمارية أو تجارية أو أنواع أخرى من النصائح أو التوصيات المقدمة أو المعتمدة من TradingView. اقرأ المزيد في شروط الاستخدام.