VWAP Momentum Band
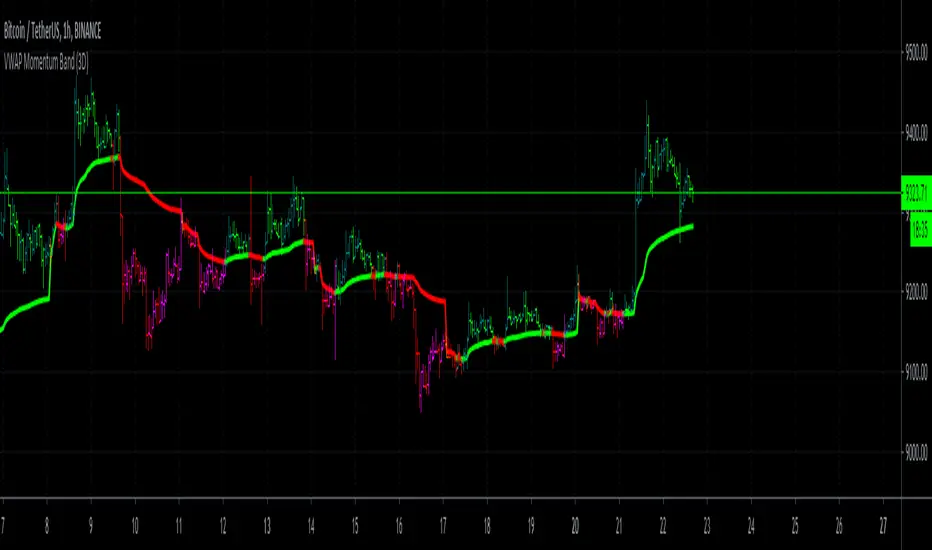
This should always be used in a bar chart. You as a trader actually just have to look for the color of the band in the middle, it tries to indicate you the coming up price action it also shows you where there is gaining momentum into your direction.
Band is green, what to do ?
Shown with the darker green candles and loosing momentum with the lighter green candles for the upward direction.
Band is red, what to do ?
Shown with the darker red color is momentum to the downwards direction and pink or lighter red color in the bars indicate loosing momentum to the downward direction.
If used correctly this indicator can also be used to feed trading bots via the Trading View Alerts.
Here are a few chart examples:
For example this for daytrading Tesla Stock.
Or daytrading NIO
If there are any questions left open, please send us a direct message!
نص برمجي للمستخدمين المدعوين فقط
يمكن فقط للمستخدمين الذين تمت الموافقة عليهم من قبل المؤلف الوصول إلى هذا البرنامج النصي. ستحتاج إلى طلب الإذن والحصول عليه لاستخدامه. يتم منح هذا عادةً بعد الدفع. لمزيد من التفاصيل، اتبع تعليمات المؤلف أدناه أو اتصل ب NEXT-LEVEL مباشرة.
لا توصي TradingView بالدفع مقابل برنامج نصي أو استخدامه إلا إذا كنت تثق تمامًا في مؤلفه وتفهم كيفية عمله. يمكنك أيضًا العثور على بدائل مجانية ومفتوحة المصدر في نصوص مجتمعنا.
تعليمات المؤلف
إخلاء المسؤولية
نص برمجي للمستخدمين المدعوين فقط
يمكن فقط للمستخدمين الذين تمت الموافقة عليهم من قبل المؤلف الوصول إلى هذا البرنامج النصي. ستحتاج إلى طلب الإذن والحصول عليه لاستخدامه. يتم منح هذا عادةً بعد الدفع. لمزيد من التفاصيل، اتبع تعليمات المؤلف أدناه أو اتصل ب NEXT-LEVEL مباشرة.
لا توصي TradingView بالدفع مقابل برنامج نصي أو استخدامه إلا إذا كنت تثق تمامًا في مؤلفه وتفهم كيفية عمله. يمكنك أيضًا العثور على بدائل مجانية ومفتوحة المصدر في نصوص مجتمعنا.