OPEN-SOURCE SCRIPT
Fixed Volatility Oscillator
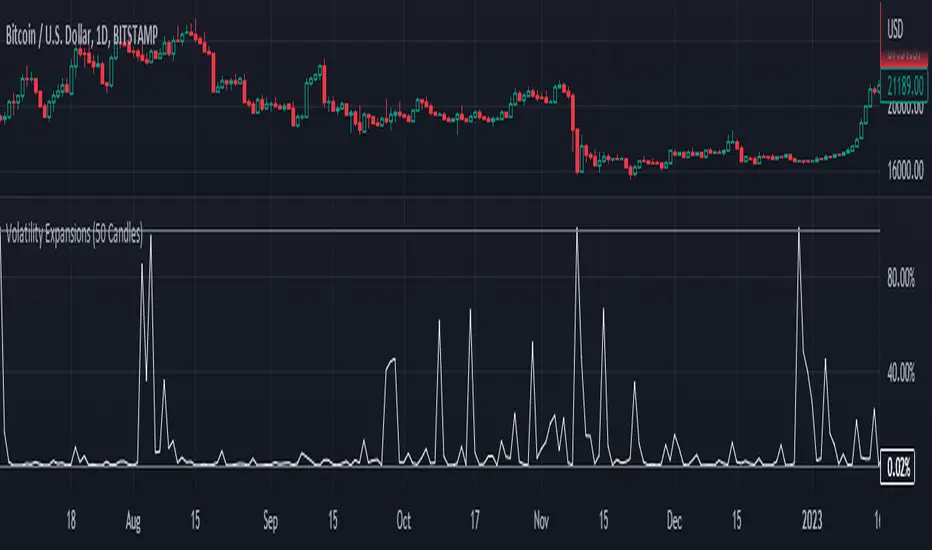
A fixed volatility plotter set to a 0-100 range - Plots the current volatility % using the formula to calculate volatility and stdev (standard deviation) based on the candle lookback.
The indicator is Fixed, which means that regardless of the chart, the volatility will be plotted on a percentage of 0% - 100% with a 101% threshold set to indicate a volatility reset. While the volume of volatility will change depending on the chart, the volatility will ALWAYS stay within this range.
if a plot exceeds 100% it should be marked as volatility reset - not an expansion
and should also be noted that the volatility spikes are also very inconsistent in volume and vary greatly.
The candle lookbacks on standard are organized be from 10 candles to 100 candles. I found the best results using the 50 candles lookback, and therefore have set it as the default value. These different values can be used to pull the information from the # of candles on the selected option - and therefore the volatility will be calculated from the number of candles selected.
// note for other people versed in pinescript
While this indicator may be useful in trading or strategies, it is more meant to incorporated into other scripts or used as a basis that can be further expanded on. The visuals are not built at all - for that purpose.
This script has not been listed as a library for the fact that it can be used as an actual indicator within a strategy - hope you enjoy.
نص برمجي مفتوح المصدر
بروح TradingView الحقيقية، قام مبتكر هذا النص البرمجي بجعله مفتوح المصدر، بحيث يمكن للمتداولين مراجعة وظائفه والتحقق منها. شكرا للمؤلف! بينما يمكنك استخدامه مجانًا، تذكر أن إعادة نشر الكود يخضع لقواعد الموقع الخاصة بنا.
إخلاء المسؤولية
لا يُقصد بالمعلومات والمنشورات أن تكون، أو تشكل، أي نصيحة مالية أو استثمارية أو تجارية أو أنواع أخرى من النصائح أو التوصيات المقدمة أو المعتمدة من TradingView. اقرأ المزيد في شروط الاستخدام.