OPEN-SOURCE SCRIPT
Relative Measured Volatility (RMV)
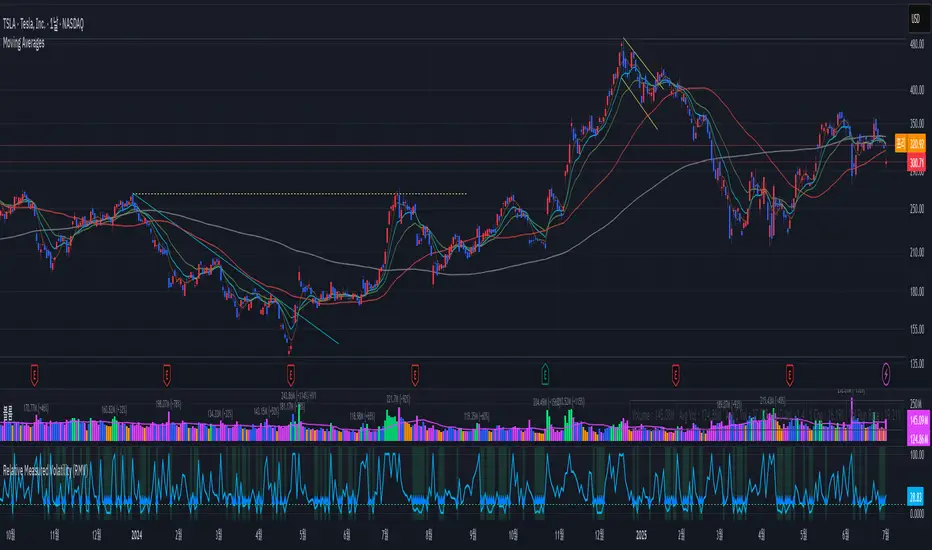
RMV • Volume-Sensitive Consolidation Indicator
A lightweight Pine Script that highlights true low-volatility, low-volume bars in a single squeeze measure.

What it does
Calculates each bar’s raw High-Low range.
Down-weights bars where volume is below its 30-day average, emphasizing genuine quiet periods.
Normalizes the result over the prior 15 bars (excluding the current bar), scaling from 0 (tightest) to 100 (most volatile).
Draws the series as a step plot, shades true “tight” bars below the user threshold, and marks sustained squeezes with a small arrow.
Key inputs
Lookback (bars): Number of bars to use for normalization (default 15).
Tight Threshold: RMV value under which a bar is considered squeezed (default 15).
Volume SMA Period: Period for the volume moving average benchmark (default 30).
How it works
Raw range: barRange = high - low
Volume ratio: volRatio = min(volume / sma(volume,30), 1)
Weighted range: vwRange = barRange * volRatio
Rolling min/max (prior 15 bars): exclude today so a new low immediately registers a 0.
Normalize: rmv = clamp(100 * (vwRange - min) / (max - min), 0, 100)
Visualization & signals
Step line for exact bar-by-bar values.
Shaded background when RMV < threshold.
Consecutive-bar filter ensures arrows only appear when tightness lasts at least two bars, cutting noise.
Why use it
Quickly spot consolidation zones that combine narrow price action with genuine dry volume—ideal for swing entries ahead of breakouts.
A lightweight Pine Script that highlights true low-volatility, low-volume bars in a single squeeze measure.
What it does
Calculates each bar’s raw High-Low range.
Down-weights bars where volume is below its 30-day average, emphasizing genuine quiet periods.
Normalizes the result over the prior 15 bars (excluding the current bar), scaling from 0 (tightest) to 100 (most volatile).
Draws the series as a step plot, shades true “tight” bars below the user threshold, and marks sustained squeezes with a small arrow.
Key inputs
Lookback (bars): Number of bars to use for normalization (default 15).
Tight Threshold: RMV value under which a bar is considered squeezed (default 15).
Volume SMA Period: Period for the volume moving average benchmark (default 30).
How it works
Raw range: barRange = high - low
Volume ratio: volRatio = min(volume / sma(volume,30), 1)
Weighted range: vwRange = barRange * volRatio
Rolling min/max (prior 15 bars): exclude today so a new low immediately registers a 0.
Normalize: rmv = clamp(100 * (vwRange - min) / (max - min), 0, 100)
Visualization & signals
Step line for exact bar-by-bar values.
Shaded background when RMV < threshold.
Consecutive-bar filter ensures arrows only appear when tightness lasts at least two bars, cutting noise.
Why use it
Quickly spot consolidation zones that combine narrow price action with genuine dry volume—ideal for swing entries ahead of breakouts.
نص برمجي مفتوح المصدر
بروح TradingView الحقيقية، قام مبتكر هذا النص البرمجي بجعله مفتوح المصدر، بحيث يمكن للمتداولين مراجعة وظائفه والتحقق منها. شكرا للمؤلف! بينما يمكنك استخدامه مجانًا، تذكر أن إعادة نشر الكود يخضع لقواعد الموقع الخاصة بنا.
إخلاء المسؤولية
لا يُقصد بالمعلومات والمنشورات أن تكون، أو تشكل، أي نصيحة مالية أو استثمارية أو تجارية أو أنواع أخرى من النصائح أو التوصيات المقدمة أو المعتمدة من TradingView. اقرأ المزيد في شروط الاستخدام.