OPEN-SOURCE SCRIPT
War Index

Introduction
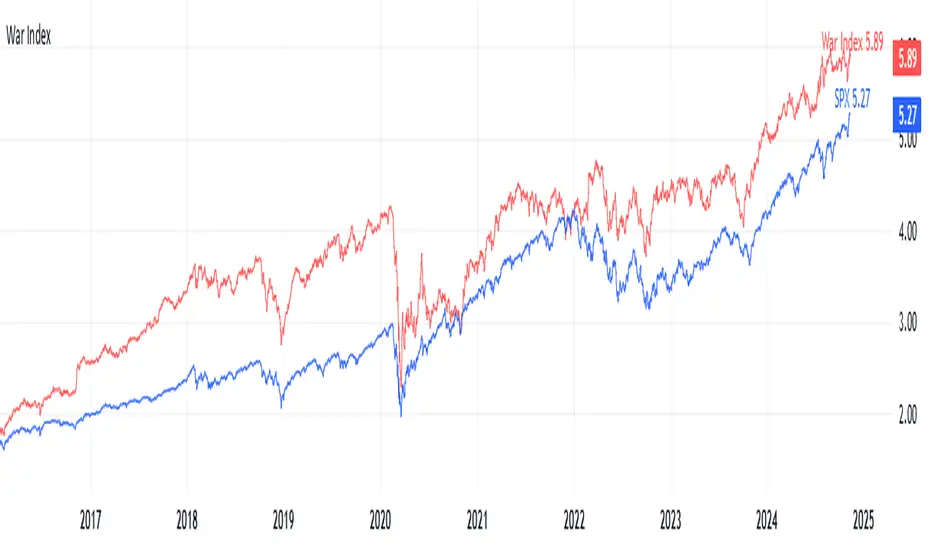
Welcome to the War Index! This project aims to provide traders, investors, and analysts with a specialized financial indicator that tracks the performance of key defense and aerospace companies. By aggregating the percentage changes of selected stocks, the War Index offers insights into the defense sector's dynamics and its relationship with the broader market.
What is the War Index?
The War Index is a custom financial indicator designed to approximate the collective performance of major defense and aerospace companies. It aggregates the daily percentage changes of selected stocks within the defense sector to provide a singular metric that reflects the overall health and trends of this industry. Additionally, the index is compared against the S&P 500 (SPX) to contextualize its performance relative to the broader market.
Index Components
The War Index comprises the following 16 stocks, each representing a significant player in the defense and aerospace industries:
Purpose of the War Index
The War Index serves several key purposes:
Disclaimer: This War Index is an approximated indicator intended for informational purposes only. It should not be construed as investment advice. Always conduct your own research or consult with a financial advisor before making investment decisions.
Welcome to the War Index! This project aims to provide traders, investors, and analysts with a specialized financial indicator that tracks the performance of key defense and aerospace companies. By aggregating the percentage changes of selected stocks, the War Index offers insights into the defense sector's dynamics and its relationship with the broader market.
What is the War Index?
The War Index is a custom financial indicator designed to approximate the collective performance of major defense and aerospace companies. It aggregates the daily percentage changes of selected stocks within the defense sector to provide a singular metric that reflects the overall health and trends of this industry. Additionally, the index is compared against the S&P 500 (SPX) to contextualize its performance relative to the broader market.
Index Components
The War Index comprises the following 16 stocks, each representing a significant player in the defense and aerospace industries:
- Lockheed Martin Corporation (
LMT )
- Northrop Grumman Corporation (
NOC )
- Boeing Company (
BA )
- Raytheon Technologies Corporation (
RTX )
- General Dynamics Corporation (
GD )
- BAE Systems plc (
BAESY )
- L3Harris Technologies, Inc. (
LHX )
- Textron Inc. (
TXT )
- Huntington Ingalls Industries, Inc. (
HII )
- Oshkosh Corporation (
OSK )
- Leidos Holdings, Inc. (
LDOS )
- Kratos Defense & Security Solutions, Inc. (
KTOS )
- Spirit AeroSystems Holdings, Inc. ( $NYSE:SPR )
- Parsons Corporation (
PSN )
- CACI International Inc (
CACI )
- ViaSat, Inc. (
VSAT )
Purpose of the War Index
The War Index serves several key purposes:
- Sector Performance Tracking: By aggregating the performance of major defense and aerospace companies, the index provides a clear picture of the sector's overall health.
- Investment Analysis: Investors can use the index to identify trends, evaluate sector strength, and make informed decisions regarding their portfolios.
- Comparative Benchmarking: Comparing the War Index with broader market indices like the S&P 500 helps in understanding how the defense sector performs relative to the general market.
Disclaimer: This War Index is an approximated indicator intended for informational purposes only. It should not be construed as investment advice. Always conduct your own research or consult with a financial advisor before making investment decisions.
نص برمجي مفتوح المصدر
بروح TradingView الحقيقية، قام مبتكر هذا النص البرمجي بجعله مفتوح المصدر، بحيث يمكن للمتداولين مراجعة وظائفه والتحقق منها. شكرا للمؤلف! بينما يمكنك استخدامه مجانًا، تذكر أن إعادة نشر الكود يخضع لقواعد الموقع الخاصة بنا.
إخلاء المسؤولية
لا يُقصد بالمعلومات والمنشورات أن تكون، أو تشكل، أي نصيحة مالية أو استثمارية أو تجارية أو أنواع أخرى من النصائح أو التوصيات المقدمة أو المعتمدة من TradingView. اقرأ المزيد في شروط الاستخدام.