OPEN-SOURCE SCRIPT
تم تحديثه OBV's %B
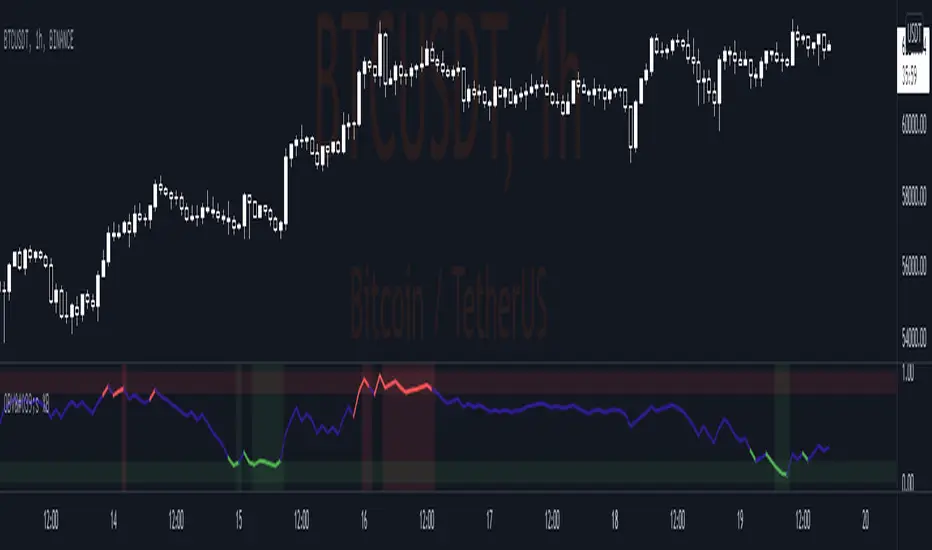
Indicator display where OBV (On Balance Volume) is in relation to the bands of Bollinger Bands (OBV,100,3)
A. OBV's Bb Info
1. Basis = SMA (OBV,100)
2. Upper Band = Basis + 3 x Standard Deviation
3. Lower Band = Basis - 3 x Standard Deviation
B. OBV's %B Info
1. %B Above 1 = OBV is Above the Upper Band
2. %B Below 0 = OBV is Below the Lower Band
3. %B Above 0.8 = OBV is Nearing the Upper Band
4. %B Below 0.20 = OBV is Nearing the Lower Band
ملاحظات الأخبار
* Update to Pine version 5* Add Signal Background
* Buy Signal:
- When obv inside Support Zone (0.0 - 0.2)
* Sell Signal:
- When obv inside Resistance Zone (0.8 - 1.0)
نص برمجي مفتوح المصدر
بروح TradingView الحقيقية، قام مبتكر هذا النص البرمجي بجعله مفتوح المصدر، بحيث يمكن للمتداولين مراجعة وظائفه والتحقق منها. شكرا للمؤلف! بينما يمكنك استخدامه مجانًا، تذكر أن إعادة نشر الكود يخضع لقواعد الموقع الخاصة بنا.
إخلاء المسؤولية
لا يُقصد بالمعلومات والمنشورات أن تكون، أو تشكل، أي نصيحة مالية أو استثمارية أو تجارية أو أنواع أخرى من النصائح أو التوصيات المقدمة أو المعتمدة من TradingView. اقرأ المزيد في شروط الاستخدام.