OPEN-SOURCE SCRIPT
NSE Option Chain
تم تحديثه
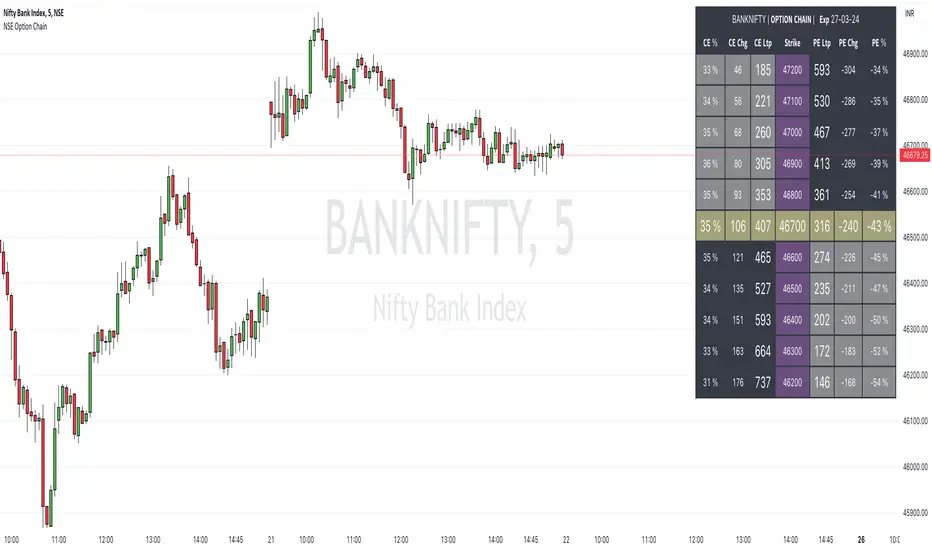
This Indicator show Options Data on signal dashboard , that help trader to analyse the market.
Options data consist of two things , Call and Put.
Every Strike has its Call and Put price.
So if user Opens any chart which is traded in options , dashboard will show total 16 Call and 16 Put strikes
8 Above from ATM and 8 Below from ATM.
On left hand side of dashboard there is Call data and on right side there is Put data.
Call side datas are , Call LTP which is latest price of that call strike , Call Chg which is change in points from previous day close and third is Call % which is % change from previous day close.
Same is on put side.
Color code is done based on positive or negative of data. If change or % is negative then color is red else green.
ATM strike data is plotted in bold
Inputs :
Spot Symbol Input for Option dashboard
Expiry date of that option contract
Strike interval between 2 strikes
Reference ATM strike ( user should keep this input as current ATM strike )
How to Use :
If dashboard shows call side is negative and put side is positive then that means market Bearish , because falling market leads to falling price of call and increase in price of Put.
Similarly if put is negative and call is positive then market is bullish.
This dashboard give trend conformation , trader should take other conformation also before taking trade.
ملاحظات الأخبار
New Updates on Dashboard layouts and colorsملاحظات الأخبار
New Updateملاحظات الأخبار
New Updateملاحظات الأخبار
Fond size updateملاحظات الأخبار
Font Size Updateملاحظات الأخبار
New Updateملاحظات الأخبار
updateنص برمجي مفتوح المصدر
قام مؤلف هذا النص البرمجي بنشره وجعله مفتوح المصدر، بحيث يمكن للمتداولين فهمه والتحقق منه، وهو الأمر الذي يدخل ضمن قيم TradingView. تحياتنا للمؤلف! يمكنك استخدامه مجانًا، ولكن إعادة استخدام هذا الرمز في المنشور يخضع لقواعدقوانين الموقع. يمكنك جعله مفضلاً لاستخدامه على الرسم البياني.
إخلاء المسؤولية
لا يُقصد بالمعلومات والمنشورات أن تكون، أو تشكل، أي نصيحة مالية أو استثمارية أو تجارية أو أنواع أخرى من النصائح أو التوصيات المقدمة أو المعتمدة من TradingView. اقرأ المزيد في شروط الاستخدام.