OPEN-SOURCE SCRIPT
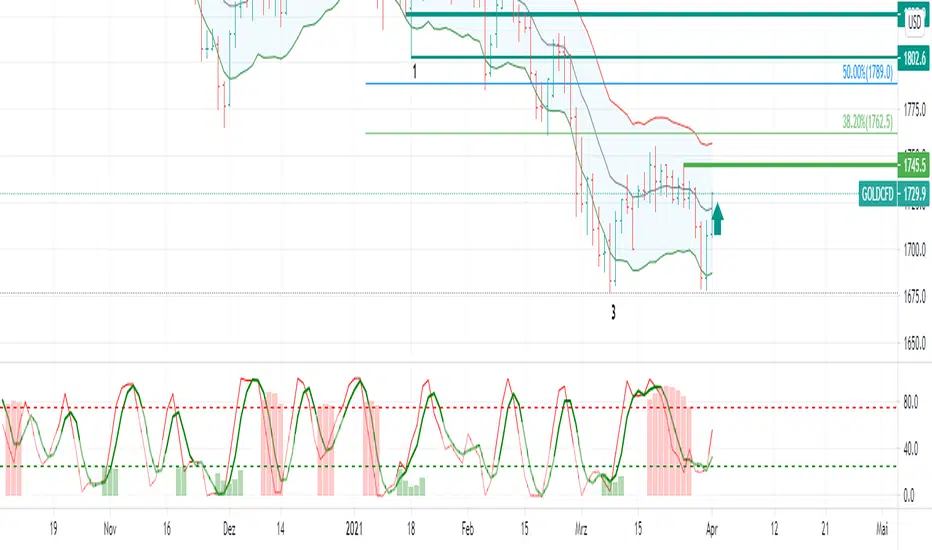
DT Dual-Lookback DLB

This script is based on the concept of Robert Miner Book "High Probabilities Strategies"
This script shows at the same time two timeframes and the overlapping area.
The green and red area shows the higher time frame period just as Robert Miner did this in his videos.
Because Robert Miner just says: 8.. 13.. 21.. i used this also as type for the setup.
This is not a complete trading strategy, but if fibonacci retracement/extensions in price and time and
elliot waves position and DT Dual-Lookback comed together there is a perhaps a signal.
Please read his book and look at his website and his DT reports to learn more about his strategy.
نص برمجي مفتوح المصدر
بروح TradingView الحقيقية، قام مبتكر هذا النص البرمجي بجعله مفتوح المصدر، بحيث يمكن للمتداولين مراجعة وظائفه والتحقق منها. شكرا للمؤلف! بينما يمكنك استخدامه مجانًا، تذكر أن إعادة نشر الكود يخضع لقواعد الموقع الخاصة بنا.
إخلاء المسؤولية
لا يُقصد بالمعلومات والمنشورات أن تكون، أو تشكل، أي نصيحة مالية أو استثمارية أو تجارية أو أنواع أخرى من النصائح أو التوصيات المقدمة أو المعتمدة من TradingView. اقرأ المزيد في شروط الاستخدام.