PROTECTED SOURCE SCRIPT
AIAE: Average Investor's Allocation To Equity

People say a bull market ends when there are no more buyers left on the market and a bear market ends when there are no more sellers. Well, this indicador shows exactly this.
It uses FRED data to compare the total value invested on stocks with the total value held by investors to find the percentage that is allocated to stocks.
The exact formula used to calculate this index was created by pseudonymous Jesse Livermore and is available for free to anyone who wishes to consult it in his blog Philosophical Economics. The only thing I'm adding here that wasn't available on Jesse's index is the color code.
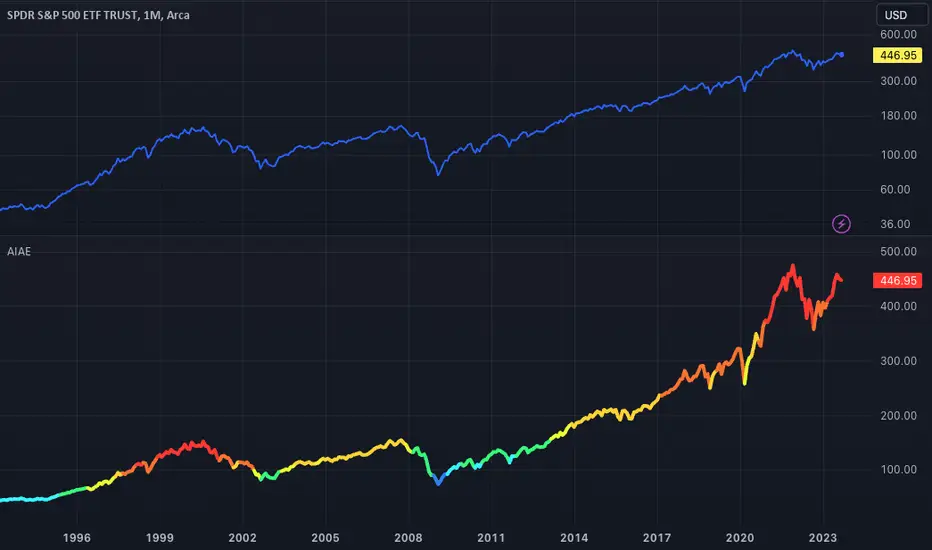
This script will use Jesse's formula to find the average investor's allocation to equity at any given time. Then, it will color the SPDR (S&P 500) according to this allocation.
A high allocation to equity means we could be close to a market correction, so it will color the SPDR in red and a low allocation means we could be close to a market bottom, so it will color the SPDR in blue.
Here's the exact color parameters used:
switch
AIAE <= 23 => priceLevel := "Gift"
AIAE > 23 and AIAE <=26 => priceLevel := "Very Cheap"
AIAE > 26 and AIAE <= 29 => priceLevel := "Cheap"
AIAE > 29 and AIAE <= 32 => priceLevel := "Slightly Cheap"
AIAE > 32 and AIAE <= 37 => priceLevel := "Neutral"
AIAE > 37 and AIAE <= 40 => priceLevel := "Slightly Expensive"
AIAE > 40 and AIAE <= 43 => priceLevel := "Expensive"
AIAE > 43 and AIAE <= 46 => priceLevel := "Very Expensive"
AIAE > 46 => priceLevel := "Exuberant"
Please note that this indicador should ONLY be used on the SPDR (S&P 500). It will not produce adequate results if used on other assets.
نص برمجي محمي
تم نشر هذا النص البرمجي كمصدر مغلق. ومع ذلك، يمكنك استخدامه بحرية ودون أي قيود - تعرف على المزيد هنا.
Mateus Rapini
إخلاء المسؤولية
لا يُقصد بالمعلومات والمنشورات أن تكون، أو تشكل، أي نصيحة مالية أو استثمارية أو تجارية أو أنواع أخرى من النصائح أو التوصيات المقدمة أو المعتمدة من TradingView. اقرأ المزيد في شروط الاستخدام.