PROTECTED SOURCE SCRIPT
Liquidity Heatmap Concepts [sma]
Overview
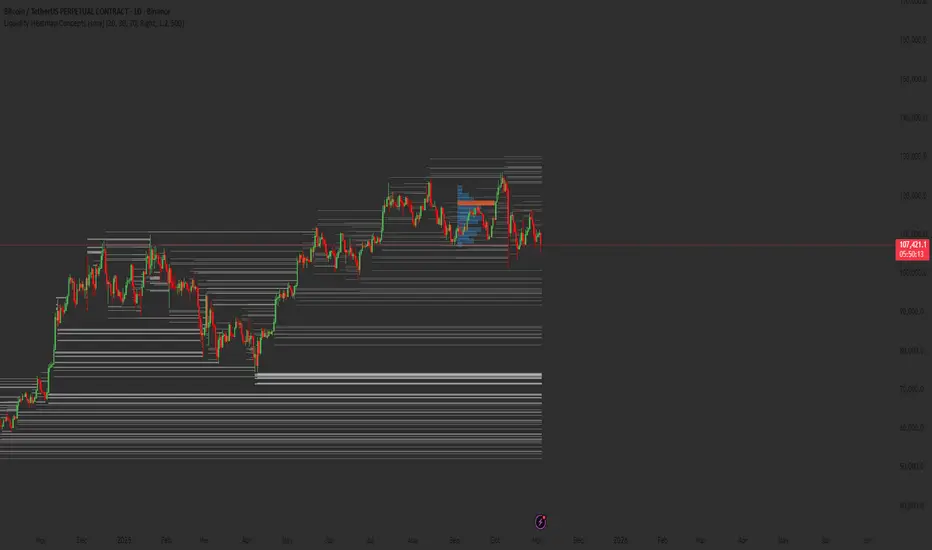
Liquidity Heatmap Concepts is a sophisticated visualization tool that maps potential liquidation zones for leveraged positions across multiple timeframes. It calculates and displays where high-volume liquidations might occur at various leverage levels (25x, 50x, 100x, 150x), helping traders identify potential support/resistance zones created by cascading liquidations. Additionally, it includes a quarterly volume profile to show historical price distribution and Point of Control levels.
### Volume-Based Trigger System
Lines are only drawn when volume exceeds a threshold:
1. Calculates 14-period simple moving average of volume
2. Applies configurable multiplier (default 1.2x) to determine significance
3. Only plots liquidation levels when current volume > (Volume SMA × Multiplier)
4. This filters out low-volume noise and focuses on meaningful zones
### Visual Intensity System
The indicator uses a gradient coloring system based on relative volume:
- **Peak Volume (White)**: When current bar has maximum volume in the dataset
- Line width: 3 pixels
- Brightest color intensity
- **Above Average Volume**: Volume exceeds average but isn't peak
- Line width: 2 pixels
- Medium color intensity
- **Standard Volume**: Exceeds threshold but below average
- Line width: 1 pixel
- Base color intensity
### Line Extension & Management
- Lines extend horizontally to the right until price crosses them
- Automatic cleanup removes lines after maximum count (default 500)
- Lines persist until invalidated by price action crossing the level
- Oldest lines are removed first when limit is reached
### Quarterly Volume Profile
An optional fixed-range volume profile that:
1. **Automatic Quarter Detection**: Identifies Q1 (Jan-Mar), Q2 (Apr-Jun), Q3 (Jul-Sep), Q4 (Oct-Dec)
2. **Price Distribution Analysis**: Divides the quarter's price range into configurable rows (default 20)
3. **Volume Aggregation**: Accumulates volume at each price level throughout the quarter
4. **POC Identification**: Highlights the price level with highest volume (Point of Control)
5. **Value Area**: Shows the price range containing 70% (configurable) of total volume
6. **Profile Drawing**: At the start of each new quarter, draws the previous quarter's profile as horizontal bars
The volume profile can be positioned on either left or right side of the quarter range with adjustable width.
## Key Features
- **Multi-Leverage Display**: Toggle between 25x, 50x, 100x, and 150x leverage levels independently
- **Dual Side Tracking**: Separate visualization for long and short liquidation zones
- **Volume-Weighted Importance**: Visual intensity correlates with volume significance
- **Gradient Coloring**: Color intensity reflects relative volume magnitude
- **Smart Line Management**: Automatic cleanup prevents chart clutter
- **Historical Context**: Quarterly volume profile shows where price spent most time
- **Fully Customizable**: All colors, thresholds, and display options are adjustable
- **HD Mode**: Uses absolute volume for more precise visualization
## Parameters
### Leverage Selection
- **25x, 50x, 100x, 150x Toggles**: Enable/disable specific leverage levels
- Each level can be controlled independently
### Volume Configuration
- **Minimum Volume Multiplier** (default 1.2): Threshold above volume SMA to trigger lines
- Higher values = fewer but more significant levels
- Lower values = more levels but increased noise
### Advanced Settings
- **Maximum Lines** (default 500, range 50-500): Memory management limit
- Controls how many historical liquidation lines are maintained
### Quarterly Volume Profile
- **Show Previous Q Volume Profile** (default on): Toggle profile visibility
- **Number of Rows** (default 20, range 10-50): Price distribution granularity
- **Profile Width** (default 30%): Visual width as percentage of quarter range
- **Value Area** (default 70%): Percentage of volume for value area calculation
- **Position** (Left/Right): Profile placement relative to quarter
- **Show Values** (default off): Display POC volume label
- **Colors**: Customizable base and POC colors
### Color Customization
- **Long Colors**: Individual colors for each leverage level (25x, 50x, 100x, 150x)
- **Short Colors**: Separate color scheme for short liquidation zones
- **VP Colors**: Base color and POC highlight color for volume profile
## Interpretation
### Liquidation Clusters
- **Dense Line Areas**: Multiple overlapping liquidation levels suggest strong magnetic zones
- **High-Volume Lines**: Brighter/thicker lines indicate more significant potential liquidations
- **Line Breaks**: Price crossing multiple liquidation lines may trigger cascade effects
### Trading Applications
- **Support/Resistance**: Liquidation clusters often act as temporary support/resistance
- **Stop Hunt Zones**: Areas where price may spike to trigger liquidations before reversing
- **Momentum Acceleration**: Breaking through dense clusters can indicate strong directional moves
- **Risk Management**: Avoid placing stops directly at obvious liquidation levels
### Volume Profile Usage
- **POC (Point of Control)**: Price level with highest volume - often acts as strong support/resistance
- **Value Area**: Where most trading activity occurred - indicates fair value range
- **Profile Shape**:
- Balanced profile (bell curve) = ranging market
- Skewed profile = trending market with acceptance at extremes
- **Profile Gaps**: Low volume areas suggest price may move quickly through these zones
### Combined Analysis
- Liquidation lines near quarterly POC create extra-strong zones
- Price returning to value area from outside often finds support/resistance
- Liquidation clusters at value area edges suggest potential reversal points
## Technical Implementation
This indicator features:
- **Custom Type Structures**: Uses type definitions for organized data storage
- `BarData`: Stores OHLCV and index information
- `LiquidityBin`: Manages arrays of line objects for each leverage level
- `VolumeProfileData`: Handles profile boxes, labels, and range data
- **Dynamic Line Objects**: Creates, updates, and deletes line primitives programmatically
- **Array-Based History**: Maintains volume history for gradient calculations
- **Intelligent Cleanup**: Automatic memory management prevents performance degradation
- **Mathematical Precision**: Leverage-based liquidation formulas ensure accurate price levels
- **Quarterly Aggregation**: Efficient volume accumulation with automatic period detection
- **Box Drawing System**: Dynamic profile visualization using box primitives
## Originality Statement
This indicator presents a unique approach to liquidity visualization:
- Implements leverage-specific liquidation price calculations based on mathematical formulas
- Uses volume-weighted gradient coloring system that adapts to relative volume significance
- Combines real-time liquidation mapping with historical volume profile analysis
- Features intelligent line lifecycle management with automatic extension and cleanup
- Integrates quarterly volume profile with configurable value area and POC detection
- Employs multi-layer visual hierarchy (line width + color intensity) for information density
- Uses custom data structures to efficiently manage hundreds of line objects simultaneously
The combination of mathematical liquidation pricing, volume-based filtering, gradient visualization, and quarterly volume distribution creates a comprehensive liquidity analysis tool.
## Best Practices
- Use on liquid markets (major cryptocurrencies, forex pairs) for best accuracy
- Lower timeframes (1m-15m) for day trading and scalping
- Higher timeframes (1h-4h) for swing trading context
- Combine with volume profile to identify high-probability reversal zones
- Watch for price reactions when approaching dense liquidation clusters
- Increase volume multiplier in choppy markets to reduce noise
- Reduce maximum lines on lower timeframes to maintain performance
- Use quarterly volume profile to understand longer-term fair value
## Important Notes
- Liquidation prices are estimates based on leverage ratios
- Actual exchange liquidation prices may vary due to:
- Maintenance margin requirements
- Mark price vs last price calculations
- Individual exchange liquidation engines
- Insurance fund mechanisms
- This tool shows potential zones, not guaranteed liquidation prices
- Volume profile resets each quarter automatically
---
Works on all timeframes and asset classes. Designed for crypto/forex leverage markets. For educational purposes only. Not financial advice.
نص برمجي محمي
تم نشر هذا النص البرمجي كمصدر مغلق. ومع ذلك، يمكنك استخدامه بحرية ودون أي قيود - تعرف على المزيد هنا.
إخلاء المسؤولية
لا يُقصد بالمعلومات والمنشورات أن تكون، أو تشكل، أي نصيحة مالية أو استثمارية أو تجارية أو أنواع أخرى من النصائح أو التوصيات المقدمة أو المعتمدة من TradingView. اقرأ المزيد في شروط الاستخدام.