OPEN-SOURCE SCRIPT
تم تحديثه Relative Strength
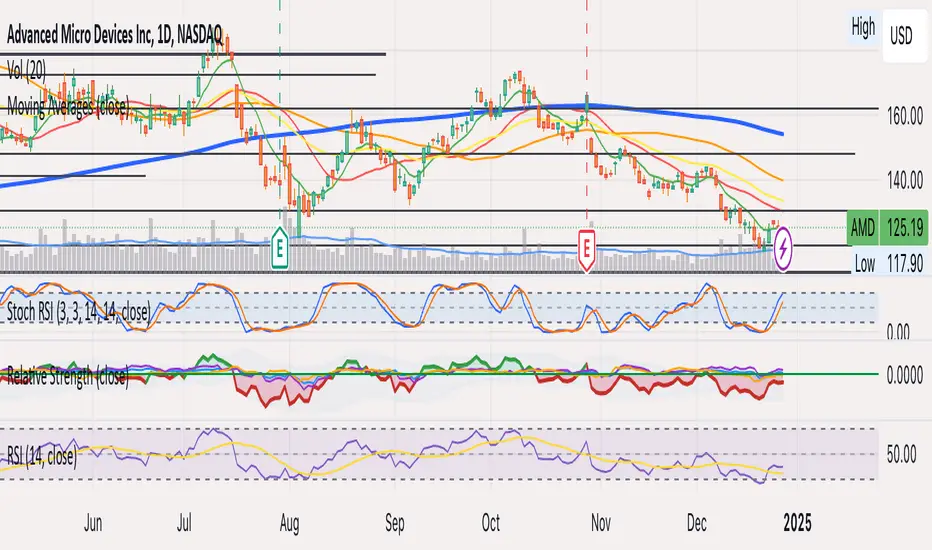
This strategy employs a custom "strength" function to assess the relative strength of a user-defined source (e.g., closing price, moving average) compared to its historical performance over various timeframes (8, 34, 20, 50, and 200 periods). The strength is calculated as a percentage change from an Exponential Moving Average (EMA) for shorter timeframes and a Simple Moving Average (SMA) for longer timeframes. Weights are then assigned to each timeframe based on a logarithmic scale, and a weighted average strength is computed.
Key Features:
Strength Calculation:
Calculates the relative strength of the source using EMAs and SMAs over various timeframes.
Assigns weights to each timeframe based on a logarithmic scale, emphasizing shorter timeframes.
Calculates a weighted average strength for a comprehensive view.
Visualizations:
Plots the calculated strength as a line, colored green for positive strength and red for negative strength.
Fills the background area below the line with green for positive strength and red for negative strength, enhancing visualization.
Comparative Analysis:
Optionally displays the strength of Bitcoin (BTC), Ethereum (ETH), S&P 500, Nasdaq, and Dow Jones Industrial Average (DJI) for comparison with the main source strength.
Backtesting:
Allows users to specify a start and end time for backtesting the strategy's performance.
Trading Signals:
Generates buy signals when the strength turns positive from negative and vice versa for sell signals.
Entry and exit are conditional on the backtesting time range.
Basic buy and sell signal plots are commented out (can be uncommented for visual representation).
Risk Management:
Closes all open positions and cancels pending orders outside the backtesting time range.
Disclaimer:
Backtesting results do not guarantee future performance. This strategy is for educational purposes only and should be thoroughly tested and refined before risking capital.
Additional Notes:
- The strategy uses a custom "strength" function that can be further customized to explore different timeframes and weighting schemes.
- Consider incorporating additional technical indicators or filters to refine the entry and exit signals.
- Backtesting with different parameters and market conditions is crucial for evaluating the strategy's robustness.
ملاحظات الأخبار
Strategy to Indicatorنص برمجي مفتوح المصدر
بروح TradingView الحقيقية، قام مبتكر هذا النص البرمجي بجعله مفتوح المصدر، بحيث يمكن للمتداولين مراجعة وظائفه والتحقق منها. شكرا للمؤلف! بينما يمكنك استخدامه مجانًا، تذكر أن إعادة نشر الكود يخضع لقواعد الموقع الخاصة بنا.
إخلاء المسؤولية
لا يُقصد بالمعلومات والمنشورات أن تكون، أو تشكل، أي نصيحة مالية أو استثمارية أو تجارية أو أنواع أخرى من النصائح أو التوصيات المقدمة أو المعتمدة من TradingView. اقرأ المزيد في شروط الاستخدام.
نص برمجي مفتوح المصدر
بروح TradingView الحقيقية، قام مبتكر هذا النص البرمجي بجعله مفتوح المصدر، بحيث يمكن للمتداولين مراجعة وظائفه والتحقق منها. شكرا للمؤلف! بينما يمكنك استخدامه مجانًا، تذكر أن إعادة نشر الكود يخضع لقواعد الموقع الخاصة بنا.
إخلاء المسؤولية
لا يُقصد بالمعلومات والمنشورات أن تكون، أو تشكل، أي نصيحة مالية أو استثمارية أو تجارية أو أنواع أخرى من النصائح أو التوصيات المقدمة أو المعتمدة من TradingView. اقرأ المزيد في شروط الاستخدام.