OPEN-SOURCE SCRIPT
تم تحديثه Bitcoin Fair Price Calculator [bitcoinfairprice.com]
1. Purpose of the scriptLong-term Bitcoin valuation based on historical time (days since Genesis block)
Fair Price = theoretically “fair” price according to power law.
Bottom Price = lower support (historically ~58% below Fair Price).
Daily display as on the website – without external access.
Buy/sell signals in case of strong overvaluation/undervaluation.
2. Mathematical model (original formula)pinescript
Bottom Price = Fair Price × 0.42
→ Corresponds historically to ~58% below Fair Price.
Days since Genesis block are calculated automatically per bar.
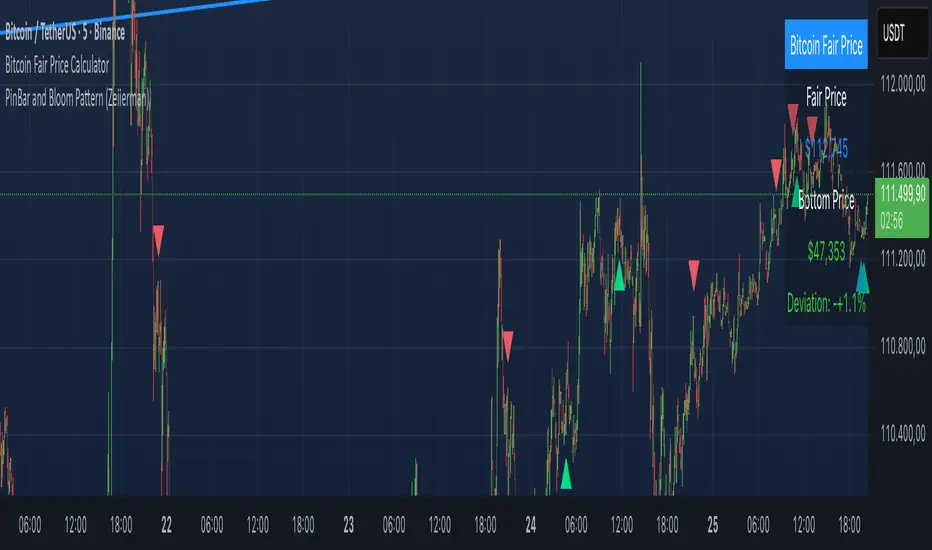
3. What is displayed in the chart?
Fair Price Average power law line (“fair price”) Blue
Bottom Price Lower support (“floor”) Green
Power Law Corridor Filled area between 0.1× and 2.5× Fair Price Light blue (transparent)
Table (top right) Daily values as on the website Black with white text
Label (for >20% deviation) Shows current prices + percentage Red (overvalued) / Green (undervalued)
4. Recommended use Timeframe
Recommendation Weekly / Monthly Best long-term signals
Daily Good balance
Log scale Be sure to activate! (Right-click on Y-axis → “Logarithmic scale”)
9. Strategy tips (based on the model)
Price near bottom --> Buy / accumulate
Price > 2.5× fair price --> Sell part of position / caution
Price between fair & bottom --> Strong buy zone
Deviation < -20% --> HODL signal
Translated with DeepL.com (free version)
Fair Price = theoretically “fair” price according to power law.
Bottom Price = lower support (historically ~58% below Fair Price).
Daily display as on the website – without external access.
Buy/sell signals in case of strong overvaluation/undervaluation.
2. Mathematical model (original formula)pinescript
Bottom Price = Fair Price × 0.42
→ Corresponds historically to ~58% below Fair Price.
Days since Genesis block are calculated automatically per bar.
3. What is displayed in the chart?
Fair Price Average power law line (“fair price”) Blue
Bottom Price Lower support (“floor”) Green
Power Law Corridor Filled area between 0.1× and 2.5× Fair Price Light blue (transparent)
Table (top right) Daily values as on the website Black with white text
Label (for >20% deviation) Shows current prices + percentage Red (overvalued) / Green (undervalued)
4. Recommended use Timeframe
Recommendation Weekly / Monthly Best long-term signals
Daily Good balance
Log scale Be sure to activate! (Right-click on Y-axis → “Logarithmic scale”)
9. Strategy tips (based on the model)
Price near bottom --> Buy / accumulate
Price > 2.5× fair price --> Sell part of position / caution
Price between fair & bottom --> Strong buy zone
Deviation < -20% --> HODL signal
Translated with DeepL.com (free version)
ملاحظات الأخبار
1. Purpose of the scriptLong-term Bitcoin valuation based on historical time (days since Genesis block)Fair Price = theoretically “fair” price according to power law.
Bottom Price = lower support (historically ~58% below Fair Price).
Daily display as on the website – without external access.
Buy/sell signals in case of strong overvaluation/undervaluation.
2. Mathematical model (original formula)pinescript
Bottom Price = Fair Price × 0.42
→ Corresponds historically to ~58% below Fair Price.
Days since Genesis block are calculated automatically per bar.
3. What is displayed in the chart?
Fair Price Average power law line (“fair price”) Blue
Bottom Price Lower support (“floor”) Green
Power Law Corridor Filled area between 0.1× and 2.5× Fair Price Light blue (transparent)
Table (top right) Daily values as on the website Black with white text
Label (for >20% deviation) Shows current prices + percentage Red (overvalued) / Green (undervalued)
4. Recommended use Timeframe
Recommendation Weekly / Monthly Best long-term signals
Daily Good balance
Log scale Be sure to activate! (Right-click on Y-axis → “Logarithmic scale”)
5. Strategy tips (based on the model)
Price near bottom --> Buy / accumulate
Price > 2.5× fair price --> Sell part of position / caution
Price between fair & bottom --> Strong buy zone
Deviation < -20% --> HODL signal
نص برمجي مفتوح المصدر
بروح TradingView الحقيقية، قام مبتكر هذا النص البرمجي بجعله مفتوح المصدر، بحيث يمكن للمتداولين مراجعة وظائفه والتحقق منها. شكرا للمؤلف! بينما يمكنك استخدامه مجانًا، تذكر أن إعادة نشر الكود يخضع لقواعد الموقع الخاصة بنا.
إخلاء المسؤولية
لا يُقصد بالمعلومات والمنشورات أن تكون، أو تشكل، أي نصيحة مالية أو استثمارية أو تجارية أو أنواع أخرى من النصائح أو التوصيات المقدمة أو المعتمدة من TradingView. اقرأ المزيد في شروط الاستخدام.