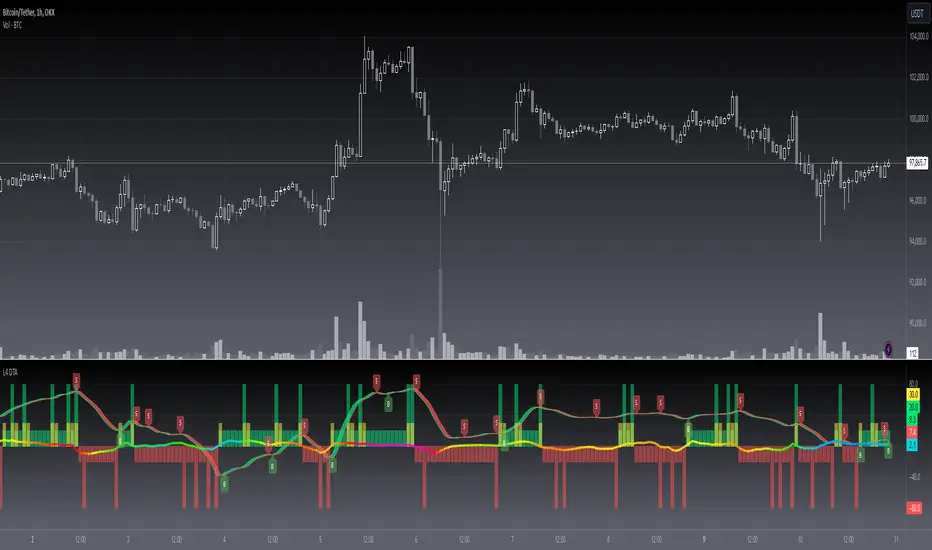
[blackcat] L4 Dynamic Trend Analysis

The script implements a dynamic trend analysis indicator named [blackcat] L4 Dynamic Trend Analysis (L4 DTA). It uses a combination of Exponential Moving Averages (EMA), Relative Strength Index (RSI), and custom functions to determine the trend direction and strength. The primary function is to visually represent the trend conditions and potential entry points on the chart.
█ FEATURES
• Initializes a gradient color array and populates it with a spectrum of colors. This gradient is used for coloring the power trend line based on the RSI value.
• Calculates the Average Linear Moving Average (ALMA) of the closing price.
• Computes the RSI of the ALMA value.
• Retrieves a color from the gradient array based on the RSI value.
• Defines a custom function dynamic_trend_analysis that calculates various trend indicators.
• Utilizes the plot function to display different trend conditions and signals on the chart.
• Adds labels to indicate short ('S') and long ('B') signals based on the trend conditions.
█ HOW TO USE
The script begins by defining the gradient color array.
It then calculates the ALMA and RSI values.
The dynamic_trend_analysis function is called, which computes several trend indicators.
Based on these indicators, the script plots different signals and trend lines on the chart.
Labels are added to indicate short and long signals when specific conditions are met.
█ CUSTOM FUNCTIONS
1 — xrf(values, length)
• Purpose: Retrieves the most recent non-NaN value from an array within a specified length.
• Parameters: values (array of float values), length (integer).
• Return Value: The most recent non-NaN value from the array within the specified length.
2 — xbs(cond, lkb)
• Purpose: Checks a condition over a specified lookback period and returns a boolean value.
• Parameters: cond (boolean condition), lkb (lookback period).
• Return Value: Boolean value indicating whether the condition was met over the lookback period.
3 — dynamic_trend_analysis(high, low, close)
• Purpose: Computes several trend indicators including short-side and long-side prices, crossovers, trend strength, and power trend.
• Parameters: high, low, close (price series).
• Return Value: An array containing trend strength (cc), moving average (ma1), trend (trend), and power trend (power_trend).
█ NOTES
• Gradient Color Array: The script uses a gradient color array to dynamically color the power trend line based on the RSI value, providing a visual indication of momentum.
• Custom Functions: The use of custom functions (xrf, xbs, dynamic_trend_analysis) encapsulates complex logic, making the script modular and easier to maintain.
• Trend Analysis: The script combines multiple indicators (EMA, RSI) to create a comprehensive trend analysis, providing multiple signals for trading decisions.
• Efficient Plotting: The script uses conditional plotting to display signals only when specific conditions are met, reducing clutter on the chart.
• Modifications: The script can be modified to include additional indicators or adjust the parameters of existing ones to better suit different trading styles or market conditions.
• Extensions: The dynamic trend analysis function can be extended to include more sophisticated trend following or reversal strategies.
• Alternative Uses: Similar techniques can be applied to other types of technical analysis, such as volatility analysis or momentum strategies.
• Related Concepts: Understanding of Pine Script functions like array.push, ta.ema, ta.rsi, and plot is beneficial for enhancing and customizing the script. Additionally, knowledge of conditional plotting and label creation can help in refining the visual output.
نص برمجي للمستخدمين المدعوين فقط
يمكن فقط للمستخدمين الذين تمت الموافقة عليهم من قبل المؤلف الوصول إلى هذا البرنامج النصي. ستحتاج إلى طلب الإذن والحصول عليه لاستخدامه. يتم منح هذا عادةً بعد الدفع. لمزيد من التفاصيل، اتبع تعليمات المؤلف أدناه أو اتصل ب blackcat1402 مباشرة.
لا توصي TradingView بالدفع مقابل برنامج نصي أو استخدامه إلا إذا كنت تثق تمامًا في مؤلفه وتفهم كيفية عمله. يمكنك أيضًا العثور على بدائل مجانية ومفتوحة المصدر في نصوص مجتمعنا.
تعليمات المؤلف
إخلاء المسؤولية
نص برمجي للمستخدمين المدعوين فقط
يمكن فقط للمستخدمين الذين تمت الموافقة عليهم من قبل المؤلف الوصول إلى هذا البرنامج النصي. ستحتاج إلى طلب الإذن والحصول عليه لاستخدامه. يتم منح هذا عادةً بعد الدفع. لمزيد من التفاصيل، اتبع تعليمات المؤلف أدناه أو اتصل ب blackcat1402 مباشرة.
لا توصي TradingView بالدفع مقابل برنامج نصي أو استخدامه إلا إذا كنت تثق تمامًا في مؤلفه وتفهم كيفية عمله. يمكنك أيضًا العثور على بدائل مجانية ومفتوحة المصدر في نصوص مجتمعنا.