PROTECTED SOURCE SCRIPT
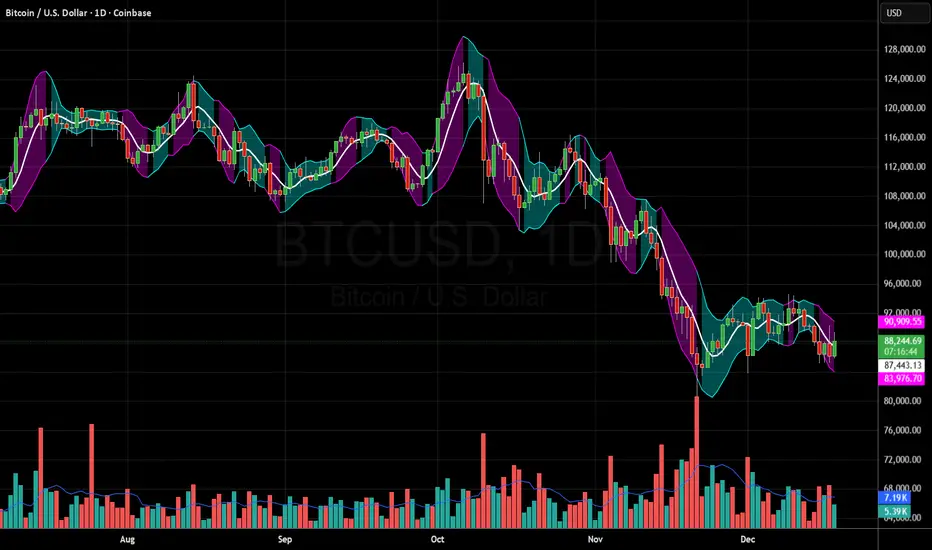
Butterworth Cloud + Squeeze (Upper)
The Butterworth Squeeze Cloud – Simple Guide
The Butterworth Cloud is a volatility + trend structure indicator that shows when the market is contracting (coiling) or expanding (breaking out) using a smoothed trend line and dynamic volatility bands.
It is designed to be easy to read visually while giving very advanced information about volatility behavior.
1. What the Butterworth Cloud Actually Measures
The indicator builds three things:
1. A smoothed trend line (Butterworth line)
This filters out noise better than a normal moving average.
When price is above it → bullish bias
When price is below it → bearish bias
When it is flat → ranging market
2. Volatility bands around the trend line
These form the “cloud.”
The cloud expands or contracts depending on volatility.
3. Color signals that show what volatility is doing
Cyan → Contracting (squeezing)
Market energy is tightening. Moves become more likely.
Magenta → Expanding (releasing)
Market is breaking out or trending.
Gray → Neutral
No strong compression or expansion.
This gives a visual map of volatility shifts, similar in concept to Bollinger squeezes, but much smoother and more reactive.
2. How to Read the Cloud at a Glance
A. Contracting Cloud (Cyan)
This signals volatility compression:
Market is coiling
Price is getting tighter around the trend line
Breakouts often follow contraction periods
The longer the cloud stays cyan, the larger the potential move afterward.
B. Expanding Cloud (Magenta)
This signals volatility expansion:
Trend activity increases
Strong directional move is underway
Expansion often begins right after a squeeze ends
Great for:
Trend continuation entries
Avoiding counter-trend trades into strength
C. Neutral Cloud (Gray)
Mixed or unstable volatility.
Often a transition zone, early chop, or slowdown.
3. How Traders Use the Butterworth Cloud
1. Spotting Squeeze → Breakout Cycles
This is the most common use.
Look for cyan contraction
Then wait for a switch to magenta
Combine with price breaking above/below structure
This setup often predicts high-momentum moves.
2. Confirming Trend Strength
Longs are higher probability when cloud is magenta & expanding upward
Shorts are higher probability when cloud is magenta & expanding downward
Avoid trading against expansion unless mean-reverting intentionally
3. Avoiding Chop
If the cloud flips:
cyan → magenta → cyan → magenta
within a short period, the market is choppy.
This helps you stand aside and avoid unnecessary losses.
4. Using the Bands for Targets
The Butterworth Cloud also includes:
Upper band
Lower band
Midline (the Butter line)
Common usage:
Long take profit at upper band
Short take profit at lower band
Mean reversion take profit at midline
Because the bands track volatility, these targets adapt to market conditions.
4. Why Use Butterworth Instead of Standard Indicators?
The Butterworth Cloud has several advantages:
1. Noise filtering
It reduces random spikes better than an EMA or SMA.
2. Cleaner squeeze detection
Unlike Bollinger Bands, it avoids overreacting to single candles.
3. Earlier expansion recognition
Especially in “EARLY” mode, it detects momentum bursts as soon as they start.
4. Works on any timeframe including seconds
Crypto scalpers especially benefit from this.
Cyan = Squeeze (volatility contracting) → market building pressure
Magenta = Expansion (volatility releasing) → breakout or trend
Use cyan → magenta transitions to detect new moves
Use bands for natural take-profits (upper for longs, lower for shorts, midline for reversions)
Works on all markets and timeframes
Very clean representation of volatility behavior
نص برمجي محمي
تم نشر هذا النص البرمجي كمصدر مغلق. ومع ذلك، يمكنك استخدامه بحرية ودون أي قيود - تعرف على المزيد هنا.
إخلاء المسؤولية
لا يُقصد بالمعلومات والمنشورات أن تكون، أو تشكل، أي نصيحة مالية أو استثمارية أو تجارية أو أنواع أخرى من النصائح أو التوصيات المقدمة أو المعتمدة من TradingView. اقرأ المزيد في شروط الاستخدام.