PROTECTED SOURCE SCRIPT
ATR Dashboard
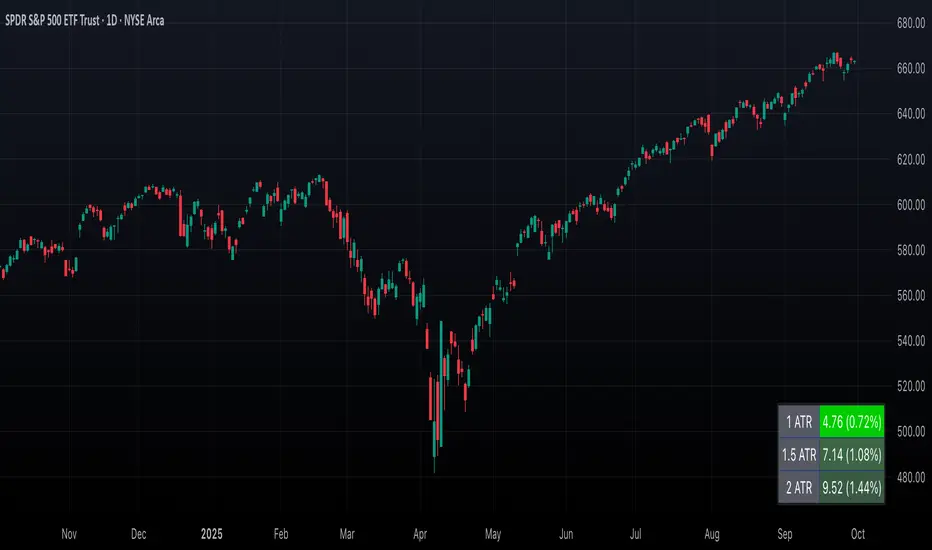
This lightweight overlay indicator displays Average True Range (ATR) values in a clean, customizable table format directly on your chart. Designed for swing traders and intraday traders alike, it transforms raw ATR data into actionable risk and position-sizing insights without adding visual clutter.
Key Features
- ATR Calculation: Fully configurable ATR period (default 14).
- Multiplier Display: Instantly see ATR-based ranges with multipliers (default 1.0x, 1.5x and 2.0x, but fully customizable).
- Risk Visualization: Color-coded percentage values show how far the price has moved relative to ATR levels—helping traders gauge volatility and overextension.
- Flexible Positioning: Choose from 9 placement options to position the dashboard wherever it best fits your chart layout.
- Real-Time Updates: Displays both absolute ATR values (in price units) and percentage equivalents, adapting instantly as price action evolves.
- Minimal & Non-Intrusive: Compact, distraction-free design ensures you get the data you need without obstructing candles or indicators.
How Traders Use It
- Swing and intraday traders use ATR not only to measure volatility but also to manage risk and identify trade levels. This dashboard makes that process intuitive:
- Volatility Gauge: Traders quickly assess whether the market is quiet (low ATR) or volatile (high ATR), guiding strategy selection.
- Dynamic Risk Levels: ATR multipliers provide context for setting stops and profit targets—e.g., placing a stop 1.5x ATR away helps filter out noise.
- Overextension Signals: If price moves too far relative to ATR (long wicks beyond ATR multiples), it can suggest exhaustion or reversal zones.
- Position Sizing: ATR-based values help traders size positions according to volatility, reducing the chance of oversized risk in choppy markets.
Perfect Use Cases
- Risk Management: Define stop-losses and profit targets relative to market volatility.
- Volatility Analysis: Adapt strategies to current market conditions.
- Swing & Intraday Trading: Identify when markets are extended and due for a retracement.
- Systematic Trading: Standardize trade execution with objective volatility metrics.
نص برمجي محمي
تم نشر هذا النص البرمجي كمصدر مغلق. However, you can use it freely and without any limitations – learn more here.
إخلاء المسؤولية
The information and publications are not meant to be, and do not constitute, financial, investment, trading, or other types of advice or recommendations supplied or endorsed by TradingView. Read more in the Terms of Use.