OPEN-SOURCE SCRIPT
تم تحديثه Bear Bull Ratio (BBR)
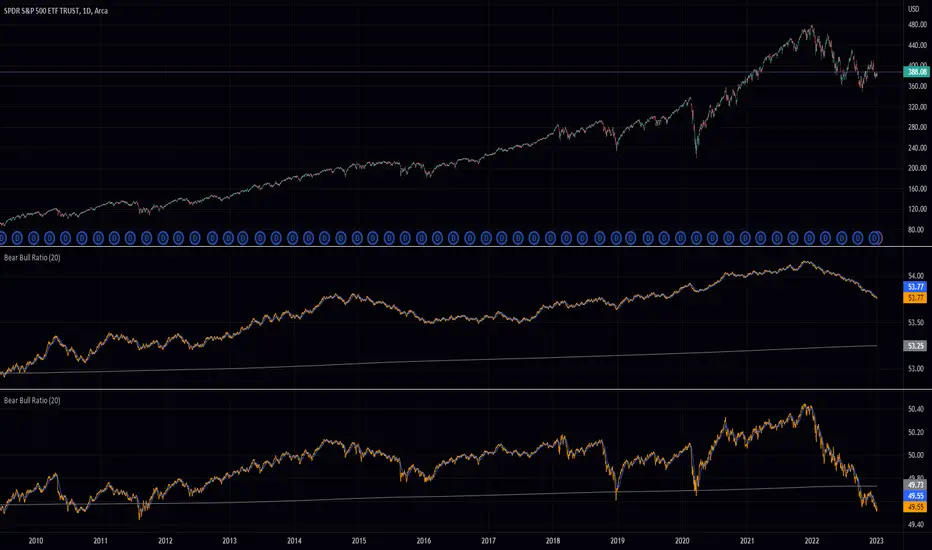
This indicator calculates the ratio of bearish to bullish candles over a certain window of time. It does this by keeping track of the number or distance (depending on the "Enable True Range Mode" input) between the high and low prices of bullish and bearish candles, respectively, and then dividing the total distance of bullish candles by the sum of the distances of both bullish and bearish candles. The resulting ratio is then plotted on the chart as a percentage. The indicator also plots a smoothed version of the ratio using a weighted moving average and the average of the ratio over the entire length of the chart, for both the "True Range Mode" and "Normal Mode".
ملاحظات الأخبار
typo fixنص برمجي مفتوح المصدر
بروح TradingView الحقيقية، قام مبتكر هذا النص البرمجي بجعله مفتوح المصدر، بحيث يمكن للمتداولين مراجعة وظائفه والتحقق منها. شكرا للمؤلف! بينما يمكنك استخدامه مجانًا، تذكر أن إعادة نشر الكود يخضع لقواعد الموقع الخاصة بنا.
إخلاء المسؤولية
لا يُقصد بالمعلومات والمنشورات أن تكون، أو تشكل، أي نصيحة مالية أو استثمارية أو تجارية أو أنواع أخرى من النصائح أو التوصيات المقدمة أو المعتمدة من TradingView. اقرأ المزيد في شروط الاستخدام.
نص برمجي مفتوح المصدر
بروح TradingView الحقيقية، قام مبتكر هذا النص البرمجي بجعله مفتوح المصدر، بحيث يمكن للمتداولين مراجعة وظائفه والتحقق منها. شكرا للمؤلف! بينما يمكنك استخدامه مجانًا، تذكر أن إعادة نشر الكود يخضع لقواعد الموقع الخاصة بنا.
إخلاء المسؤولية
لا يُقصد بالمعلومات والمنشورات أن تكون، أو تشكل، أي نصيحة مالية أو استثمارية أو تجارية أو أنواع أخرى من النصائح أو التوصيات المقدمة أو المعتمدة من TradingView. اقرأ المزيد في شروط الاستخدام.