OPEN-SOURCE SCRIPT
تم تحديثه Ehler's Autocorrelation Periodogram - RSI/MFI
Warning! Frequently hits the execution time limit for scripts.
Especially on initially adding to your chart. Often requires toggling show/hide indicator to get it to complete script execution within the time limit. YMMV!
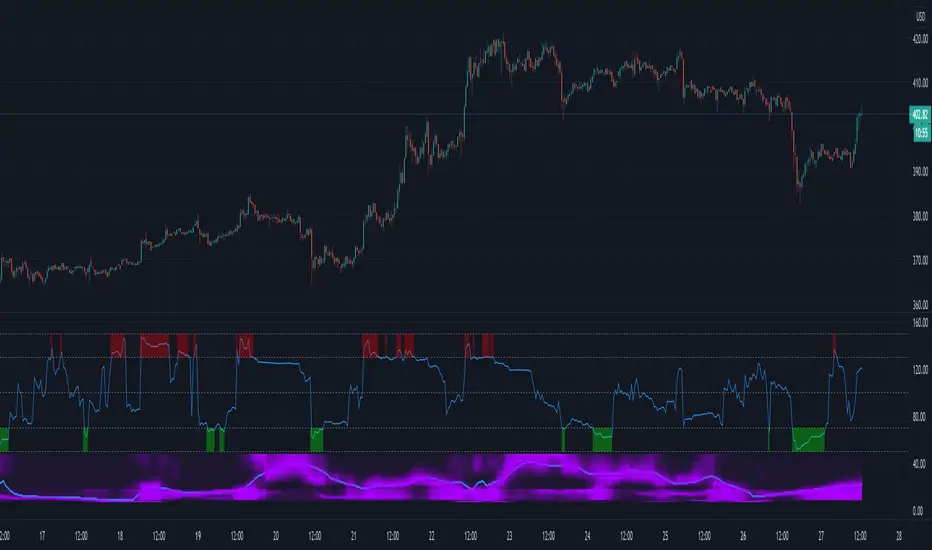
From TASC Sept 2016 this is Ehler's Autocorrelation periodogram. A means of determining the dominant cycle ("ideal" indicator length / dynamic length).
As an example it's applied here to RSI or MFI. Lower indicator segment displays the autocorrelation spectrum and the computed dominant cycle. Upper segment is RSI/MFI.
Especially on initially adding to your chart. Often requires toggling show/hide indicator to get it to complete script execution within the time limit. YMMV!
From TASC Sept 2016 this is Ehler's Autocorrelation periodogram. A means of determining the dominant cycle ("ideal" indicator length / dynamic length).
As an example it's applied here to RSI or MFI. Lower indicator segment displays the autocorrelation spectrum and the computed dominant cycle. Upper segment is RSI/MFI.
ملاحظات الأخبار
Corrected error in calculationملاحظات الأخبار
Another fix and initial r valuesملاحظات الأخبار
Corrected HP filterنص برمجي مفتوح المصدر
بروح TradingView الحقيقية، قام مبتكر هذا النص البرمجي بجعله مفتوح المصدر، بحيث يمكن للمتداولين مراجعة وظائفه والتحقق منها. شكرا للمؤلف! بينما يمكنك استخدامه مجانًا، تذكر أن إعادة نشر الكود يخضع لقواعد الموقع الخاصة بنا.
إخلاء المسؤولية
لا يُقصد بالمعلومات والمنشورات أن تكون، أو تشكل، أي نصيحة مالية أو استثمارية أو تجارية أو أنواع أخرى من النصائح أو التوصيات المقدمة أو المعتمدة من TradingView. اقرأ المزيد في شروط الاستخدام.
نص برمجي مفتوح المصدر
بروح TradingView الحقيقية، قام مبتكر هذا النص البرمجي بجعله مفتوح المصدر، بحيث يمكن للمتداولين مراجعة وظائفه والتحقق منها. شكرا للمؤلف! بينما يمكنك استخدامه مجانًا، تذكر أن إعادة نشر الكود يخضع لقواعد الموقع الخاصة بنا.
إخلاء المسؤولية
لا يُقصد بالمعلومات والمنشورات أن تكون، أو تشكل، أي نصيحة مالية أو استثمارية أو تجارية أو أنواع أخرى من النصائح أو التوصيات المقدمة أو المعتمدة من TradingView. اقرأ المزيد في شروط الاستخدام.