OPEN-SOURCE SCRIPT
Custom Fibonacci Strategy
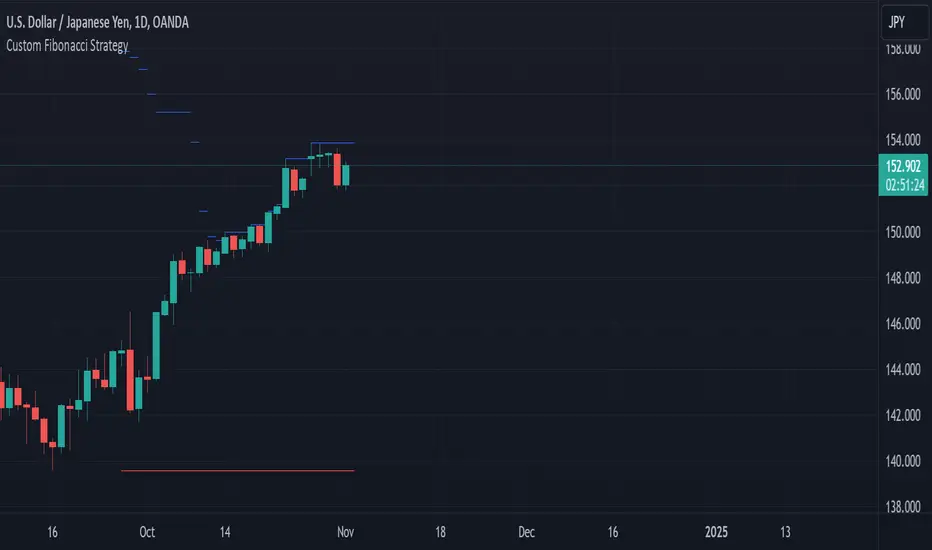
Custom Fibonacci Strategy:
This strategy relies on analyzing Fibonacci levels to identify entry points for trades. It works by identifying peaks and troughs over a specified time period (50 bars in this code). Here are the steps of the strategy:
Identifying Peaks and Troughs:
The highest peak and lowest trough over the last 50 bars are identified.
If the price exceeds the previous peak, it is considered a break of the peak.
If the price falls below the previous trough after breaking the peak, it is considered a break of the trough.
Calculating Fibonacci Levels:
The 50% level (midway point) between the identified peak and trough is calculated.
Buy Signals:
When a trough is broken, and the price trades at or below the 50% level, the risk-to-reward ratio is evaluated.
If the risk-to-reward ratio is greater than or equal to 2, a buy signal is generated.
Displaying Levels:
Horizontal lines are displayed on the chart to illustrate the peak, trough, and Fibonacci level.
Summary
This strategy provides a systematic approach to trading based on Fibonacci retracement levels and price action, allowing traders to make informed decisions about entry points and manage risk effectively.
نص برمجي مفتوح المصدر
بروح TradingView الحقيقية، قام مبتكر هذا النص البرمجي بجعله مفتوح المصدر، بحيث يمكن للمتداولين مراجعة وظائفه والتحقق منها. شكرا للمؤلف! بينما يمكنك استخدامه مجانًا، تذكر أن إعادة نشر الكود يخضع لقواعد الموقع الخاصة بنا.
إخلاء المسؤولية
لا يُقصد بالمعلومات والمنشورات أن تكون، أو تشكل، أي نصيحة مالية أو استثمارية أو تجارية أو أنواع أخرى من النصائح أو التوصيات المقدمة أو المعتمدة من TradingView. اقرأ المزيد في شروط الاستخدام.