INVITE-ONLY SCRIPT
GODXBT OSC
تم تحديثه

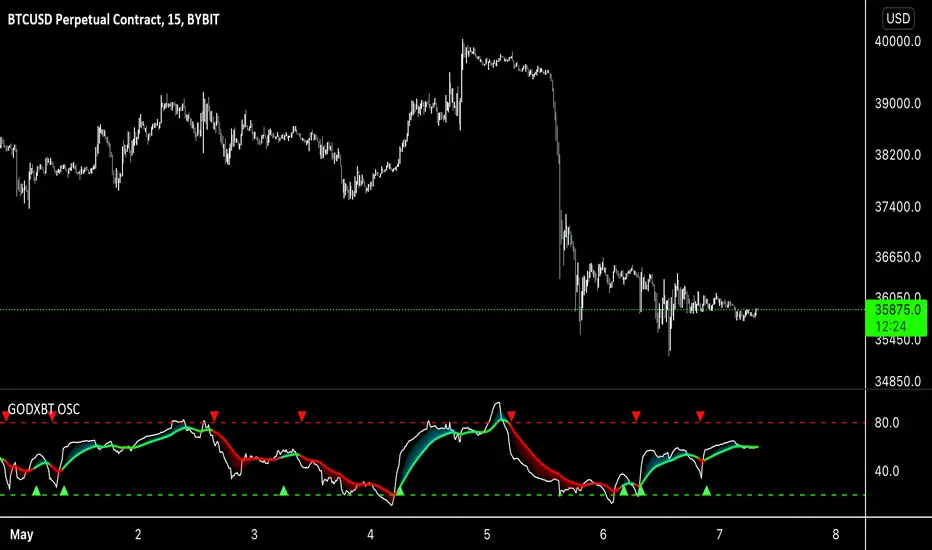
Godxbt Osc is Oscillator based on PRICE ACTION,VOLUME AND RSI (RELATIVE STRENGTH INDEX)
Allows you to understand the market trend based on price action
Includes guppy on RSI for better understanding of the trend
Blue trend on guppy suggests market is bullish
Red trend on guppy suggests market is bearish
Green triangle suggests price is about to go higher
Red triangle suggests price is about to go lower
Bar colours based on oscillator movements
Green bars are for bullish trend
Red bars are for bearish trend
No bar colors suggests trend is fading suggests take profits points
Dm for access
ملاحظات الأخبار
Added alerts نص برمجي للمستخدمين المدعوين فقط
الوصول إلى هذا النص مقيد للمستخدمين المصرح لهم من قبل المؤلف وعادة ما يكون الدفع مطلوباً. يمكنك إضافته إلى مفضلاتك، لكن لن تتمكن من استخدامه إلا بعد طلب الإذن والحصول عليه من مؤلفه. تواصل مع GODFATHER711 للحصول على مزيد من المعلومات، أو اتبع إرشادات المؤلف أدناه.
لا تقترح TradingView الدفع مقابل النصوص البرمجية واستخدامها حتى تثق بنسبة 100٪ في مؤلفها وتفهم كيفية عملها. في كثير من الحالات، يمكنك العثور على بديل جيد مفتوح المصدر مجانًا في نصوص مجتمع الخاصة بنا .
تعليمات المؤلف
″Dm for access
هل تريد استخدام هذا النص البرمجي على الرسم البياني؟
تحذير: يرجى القراءة قبل طلب الوصول.
إخلاء المسؤولية
لا يُقصد بالمعلومات والمنشورات أن تكون، أو تشكل، أي نصيحة مالية أو استثمارية أو تجارية أو أنواع أخرى من النصائح أو التوصيات المقدمة أو المعتمدة من TradingView. اقرأ المزيد في شروط الاستخدام.