OPEN-SOURCE SCRIPT
تم تحديثه Market Info Bar Charts - Was Bored
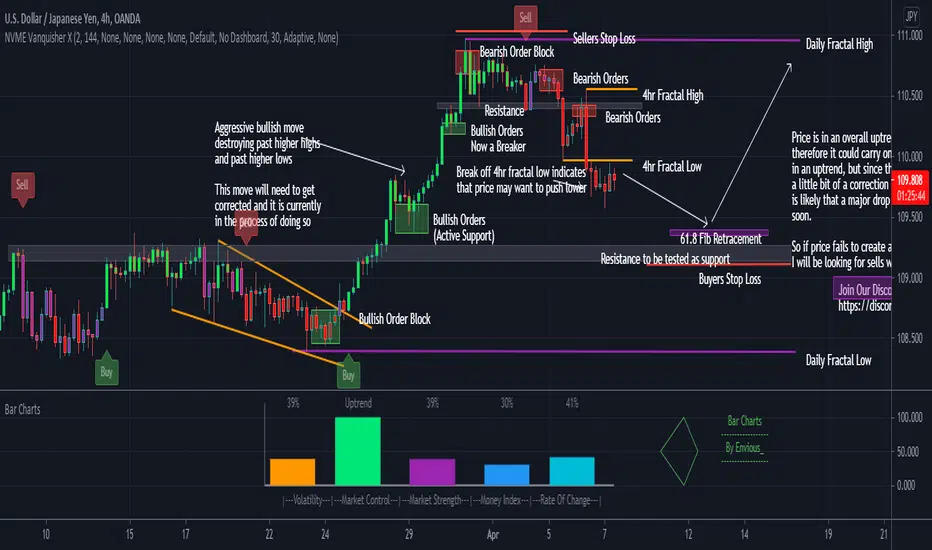
Simple script in a form of a bar chart showing you some market information ;)
ملاحظات الأخبار
Added Information:Volatility is calculated using the relative volatility index
Market Control is calculated using exponential moving averages and the percent of the strength is based on how many bars the market goes on in that trend.
Market Strength is calculated with RSI and will change colour if it is overbought (red) or oversold (green)
Money Index is calculated with Money Flow Index
Rate of Change is calculated with ROC but it cannot go to a negative number and the max it can go up to is a 100%.
You can change anything in this market info bar chart indicator if you need :)
ملاحظات الأخبار
Changed the font-size so that it suits the bar charts on different time-frames (still isn't fully accurate due to the limitation of font-sizes on pinescript)نص برمجي مفتوح المصدر
بروح TradingView الحقيقية، قام مبتكر هذا النص البرمجي بجعله مفتوح المصدر، بحيث يمكن للمتداولين مراجعة وظائفه والتحقق منها. شكرا للمؤلف! بينما يمكنك استخدامه مجانًا، تذكر أن إعادة نشر الكود يخضع لقواعد الموقع الخاصة بنا.
إخلاء المسؤولية
لا يُقصد بالمعلومات والمنشورات أن تكون، أو تشكل، أي نصيحة مالية أو استثمارية أو تجارية أو أنواع أخرى من النصائح أو التوصيات المقدمة أو المعتمدة من TradingView. اقرأ المزيد في شروط الاستخدام.
نص برمجي مفتوح المصدر
بروح TradingView الحقيقية، قام مبتكر هذا النص البرمجي بجعله مفتوح المصدر، بحيث يمكن للمتداولين مراجعة وظائفه والتحقق منها. شكرا للمؤلف! بينما يمكنك استخدامه مجانًا، تذكر أن إعادة نشر الكود يخضع لقواعد الموقع الخاصة بنا.
إخلاء المسؤولية
لا يُقصد بالمعلومات والمنشورات أن تكون، أو تشكل، أي نصيحة مالية أو استثمارية أو تجارية أو أنواع أخرى من النصائح أو التوصيات المقدمة أو المعتمدة من TradingView. اقرأ المزيد في شروط الاستخدام.