OPEN-SOURCE SCRIPT
20 Week SMA Risk Rating
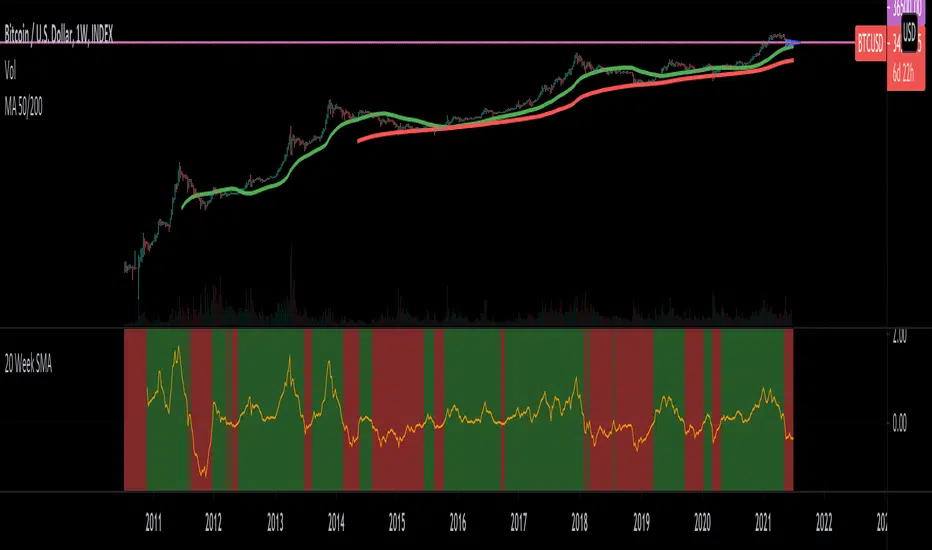
Use this indicator in the Weekly graph.
Green background indicates we are above the 20-day SMA; red background indicates we are under the 20-day SMA.
The lower we are the 20-day SMA indicates the bottom is near. The higher we are the 20-day SMA indicates there's the possibility to start climbing down.
Green background indicates we are above the 20-day SMA; red background indicates we are under the 20-day SMA.
The lower we are the 20-day SMA indicates the bottom is near. The higher we are the 20-day SMA indicates there's the possibility to start climbing down.
نص برمجي مفتوح المصدر
بروح TradingView الحقيقية، قام مبتكر هذا النص البرمجي بجعله مفتوح المصدر، بحيث يمكن للمتداولين مراجعة وظائفه والتحقق منها. شكرا للمؤلف! بينما يمكنك استخدامه مجانًا، تذكر أن إعادة نشر الكود يخضع لقواعد الموقع الخاصة بنا.
إخلاء المسؤولية
لا يُقصد بالمعلومات والمنشورات أن تكون، أو تشكل، أي نصيحة مالية أو استثمارية أو تجارية أو أنواع أخرى من النصائح أو التوصيات المقدمة أو المعتمدة من TradingView. اقرأ المزيد في شروط الاستخدام.