INVITE-ONLY SCRIPT
VPBar‴ | Volume & Volatility Power Bar‴

What does it do?
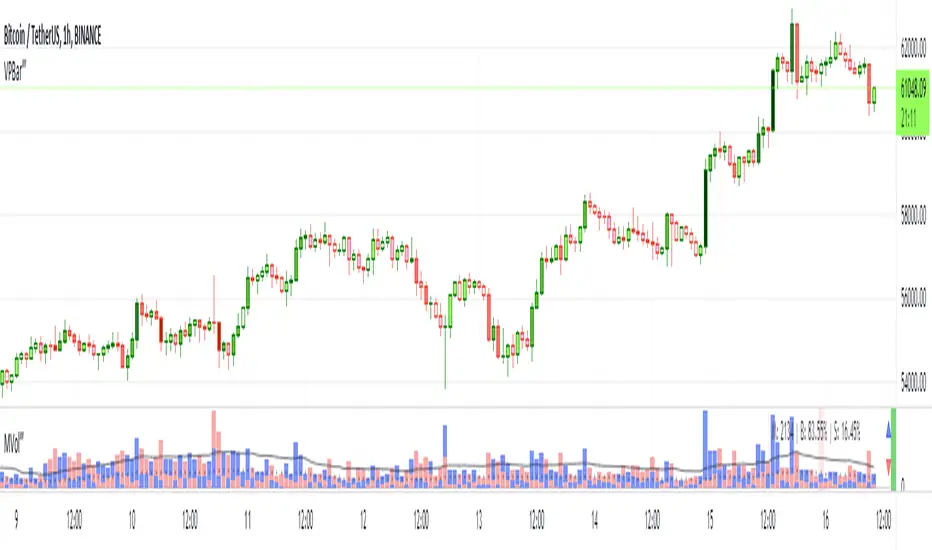
Draws the volume demand into the candlestick in order for you to identify the volume power in during candle formation.
How does it work?
Super easy. It's not too obvious how the volume power affects the market movement by just looking at the volume bars. This indicator transfere to the candlesticks the volume power demand which helps the trader understand the more/less probability of the market moving foward or reverting.
What's my filling?
Gives you a quick perception of the lastes market demand over the market movement. It makes total sence seeing the volume in such a very obvious format.
Indicator features:
- Volume Power (1): green and red gradient volume power (5 green gradients and 5 red gradients)
- Volume Power (2): market standard gradient for positive and negative candles (only 5 colors for both market directions - doesn't help allot, reason why I created this indicator)
- Trend Color Bar: let the candlesticks show you the trend and its reversal
- Momentum Power: besides to the above features, you can add a momentum power indicator with arrow and/or moving average lines crossing
To have access to this indicator, please DM me.
Don't contact me in the comment area.
نص برمجي للمستخدمين المدعوين فقط
الوصول إلى هذا النص مقيد للمستخدمين المصرح لهم من قبل المؤلف وعادة ما يكون الدفع مطلوباً. يمكنك إضافته إلى مفضلاتك، لكن لن تتمكن من استخدامه إلا بعد طلب الإذن والحصول عليه من مؤلفه. تواصل مع MarceloTorres للحصول على مزيد من المعلومات، أو اتبع إرشادات المؤلف أدناه.
لا تقترح TradingView الدفع مقابل النصوص البرمجية واستخدامها حتى تثق بنسبة 100٪ في مؤلفها وتفهم كيفية عملها. في كثير من الحالات، يمكنك العثور على بديل جيد مفتوح المصدر مجانًا في نصوص مجتمع الخاصة بنا .
تعليمات المؤلف
″To have access to this indicator, please DM me.
Don't contact me in the comment area.
هل تريد استخدام هذا النص البرمجي على الرسم البياني؟
تحذير: يرجى القراءة قبل طلب الوصول.
TRADEWISER | Marcelo Torres
marcelo@tradewiser.pro
Vídeo-Análise completa diária no YouTube:
youtube.com/c/TradeWiserPro
Curso/AE
CursoAE.TradeWiser.pro
@TradeWiserPro
Telegram, Twitter, Facebook, LinkedIn, Instagram
marcelo@tradewiser.pro
Vídeo-Análise completa diária no YouTube:
youtube.com/c/TradeWiserPro
Curso/AE
CursoAE.TradeWiser.pro
@TradeWiserPro
Telegram, Twitter, Facebook, LinkedIn, Instagram
إخلاء المسؤولية
لا يُقصد بالمعلومات والمنشورات أن تكون، أو تشكل، أي نصيحة مالية أو استثمارية أو تجارية أو أنواع أخرى من النصائح أو التوصيات المقدمة أو المعتمدة من TradingView. اقرأ المزيد في شروط الاستخدام.