OPEN-SOURCE SCRIPT
SuperRange - evo
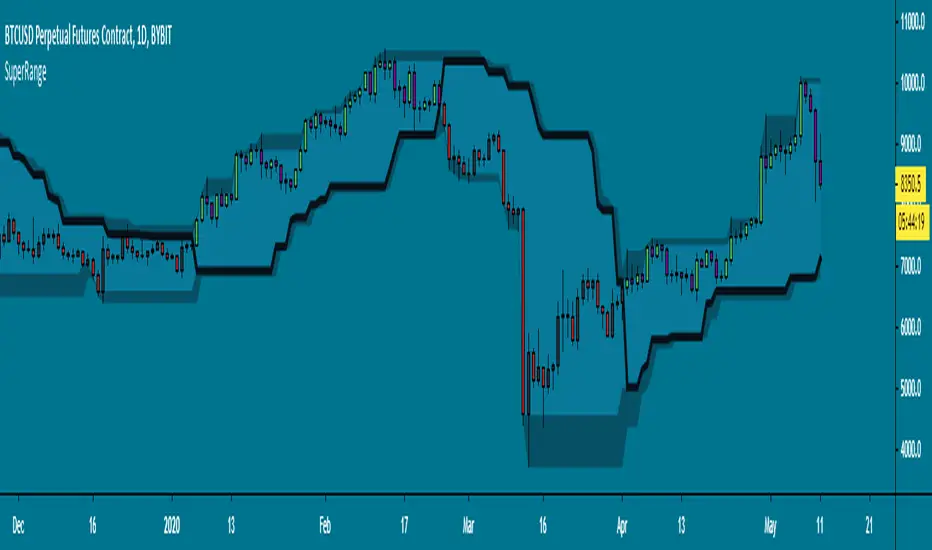
A SuperTrend like indicator based on highest and lowest candle close from a few bars back. It looks almost the same as Donchian Channels but with a dominant trend direction inside (Black line).
Uptrend: Candle closed higher than highest close
Downtrend: Candle closed lower than lowest close
This works best on higher time frames since a daily close is more powerful than a 15 minute close.
A few examples how you could use this:
Use support & resistance

Apply a moving average

Buy and sell the break-out

All perfect world examples, this does not happen all the time off course.. Its just for the idea. There are many ways to trade this so feel free to share in the comments, good luck and follow the trend! :)
Uptrend: Candle closed higher than highest close
Downtrend: Candle closed lower than lowest close
This works best on higher time frames since a daily close is more powerful than a 15 minute close.
A few examples how you could use this:
Use support & resistance
Apply a moving average
Buy and sell the break-out
All perfect world examples, this does not happen all the time off course.. Its just for the idea. There are many ways to trade this so feel free to share in the comments, good luck and follow the trend! :)
نص برمجي مفتوح المصدر
بروح TradingView الحقيقية، قام مبتكر هذا النص البرمجي بجعله مفتوح المصدر، بحيث يمكن للمتداولين مراجعة وظائفه والتحقق منها. شكرا للمؤلف! بينما يمكنك استخدامه مجانًا، تذكر أن إعادة نشر الكود يخضع لقواعد الموقع الخاصة بنا.
إخلاء المسؤولية
لا يُقصد بالمعلومات والمنشورات أن تكون، أو تشكل، أي نصيحة مالية أو استثمارية أو تجارية أو أنواع أخرى من النصائح أو التوصيات المقدمة أو المعتمدة من TradingView. اقرأ المزيد في شروط الاستخدام.