ETP SignalManager

This indicator is a trader's tool used to generate long/short signals. These signals are crafted by customizing specific conditions set up by the trader, depending on their trading system.
🔑 Key Features:
Signal Types: Generates both long and short signals.
Custom Conditions: Users can define up to 10 conditions via SignalManager in order to generate a signal.
Comparison: You can establish conditions by:
- Comparing two indicators.
- Comparing an indicator against a fixed value.
- Comparing default sources such as low, high, close, and open – either between two sources or pairing a source with another indicator.
- Using relational operators like >, <, >=, <=, crossing above, and crossing below.
Indicator Selection: For the indicators used in conditions, you can choose from any loaded indicator on your chart.
Condition Relationships: Combine up to 10 conditions using AND or OR.
Visual Alerts: These alerts activate when the specific conditions are met. They can be displayed or hidden using the dedicated options in the indicator settings. The options for visual alerts are:
- Background coloring and
- Chart-shape drawings
💡 Benefits:
- Eliminate the need for programming skills.
- Ability to backtest trading signals before investing real funds or before commissioning full programming.
- Save on costs from hiring external programming services.
🎯 In Summary:
Combine indicators to obtain the desired trading signal and backtest your trading idea without any programming skill or expertise.
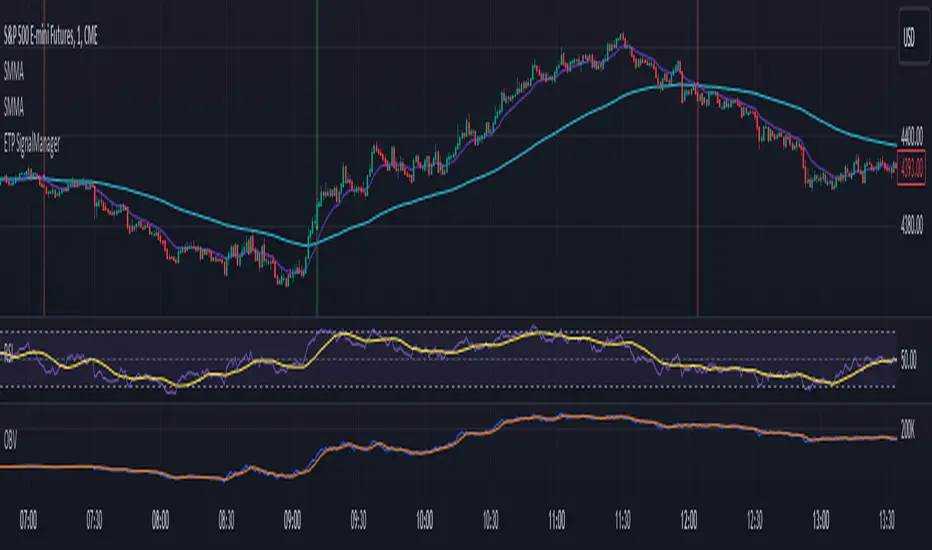
📊 Chart Example:
In the chart below, we utilized a combination of four indicators to generate trading signals:
Indicators Used:
- Short-term Smoothed Moving Average (SMMA)
- Long-term Smoothed Moving Average (SMMA)
- Relative Strength Index (RSI)
- On-Balance Volume (OBV)
Additional Rule:
The relation between the close of the current bar and the close of the previous bar.
🔧 Signal Manager Configuration:
For a Long Signal:
- Short-term SMMA crosses above the long-term SMMA. This indicates a potential bullish trend.
- Simultaneously, RSI is below 70. This condition ensures that the market is not overbought, making it suitable for a long trade.
- The OBV blue line is above the OBV orange line from 3 bars back. This 3-bar offset accounts for the lag in the orange line, and it confirms increasing buying pressure following the SMMA crossover.
- The close of the current bar should be above the close of the previous bar. This rule adds an extra layer of confirmation to the long trade setup.
For a Short Signal:
- Short-term SMMA crosses below the long-term SMMA. This suggests a potential bearish trend.
- Simultaneously, RSI is above 30. This condition ensures that the market is not oversold, making it suitable for a short trade.
- The OBV blue line is below the OBV orange line from 3 bars back. This 3-bar offset accounts for the lag in the orange line and confirms increasing selling pressure following the SMMA crossover.
- The close of the current bar should be below the close of the previous bar. This rule adds an extra layer of confirmation to the short trade setup.
🚨 Visual Alerts: As you can see on the chart, both visual alerts are active: background coloring and chart-shape drawing. Whenever the conditions mentioned above are met, the visual alert will appear on the bar that satisfies those conditions. This visual feedback enhances your ability to identify potential trade setups quickly and effectively.
This example illustrates a combination of indicators employed to generate trading signals. However, it's essential to recognize that the possibilities are vast when it comes to using indicators to create trading conditions. You can leverage any indicator you have loaded on your chart to establish criteria for trade signals. The key lies in understanding your selected indicators and crafting a strategy that aligns with your trading objectives and market analysis.
Please make sure to check your TradingView plan to determine the number of different indicators you can load on your chart. Your plan will dictate how many indicators you can effectively combine within the Signal Manager. Understanding your plan's limitations is crucial to optimizing your trading strategy.
نص برمجي للمستخدمين المدعوين فقط
يمكن فقط للمستخدمين الذين تمت الموافقة عليهم من قبل المؤلف الوصول إلى هذا البرنامج النصي. ستحتاج إلى طلب الإذن والحصول عليه لاستخدامه. يتم منح هذا عادةً بعد الدفع. لمزيد من التفاصيل، اتبع تعليمات المؤلف أدناه أو اتصل ب ETP_Page مباشرة.
لا توصي TradingView بالدفع مقابل برنامج نصي أو استخدامه إلا إذا كنت تثق تمامًا في مؤلفه وتفهم كيفية عمله. يمكنك أيضًا العثور على بدائل مجانية ومفتوحة المصدر في نصوص مجتمعنا.
تعليمات المؤلف
Founders of,
Expert Trading Programmers (experttradingprogrammers.com),
GET AUTOMATED!
Contact us via:
E-mail: support@experttradingprogrammers.com
Telegram: @AdrianT_ETP
Skype: experttradingprogrammers (Adrian T)
إخلاء المسؤولية
نص برمجي للمستخدمين المدعوين فقط
يمكن فقط للمستخدمين الذين تمت الموافقة عليهم من قبل المؤلف الوصول إلى هذا البرنامج النصي. ستحتاج إلى طلب الإذن والحصول عليه لاستخدامه. يتم منح هذا عادةً بعد الدفع. لمزيد من التفاصيل، اتبع تعليمات المؤلف أدناه أو اتصل ب ETP_Page مباشرة.
لا توصي TradingView بالدفع مقابل برنامج نصي أو استخدامه إلا إذا كنت تثق تمامًا في مؤلفه وتفهم كيفية عمله. يمكنك أيضًا العثور على بدائل مجانية ومفتوحة المصدر في نصوص مجتمعنا.
تعليمات المؤلف
Founders of,
Expert Trading Programmers (experttradingprogrammers.com),
GET AUTOMATED!
Contact us via:
E-mail: support@experttradingprogrammers.com
Telegram: @AdrianT_ETP
Skype: experttradingprogrammers (Adrian T)