OPEN-SOURCE SCRIPT
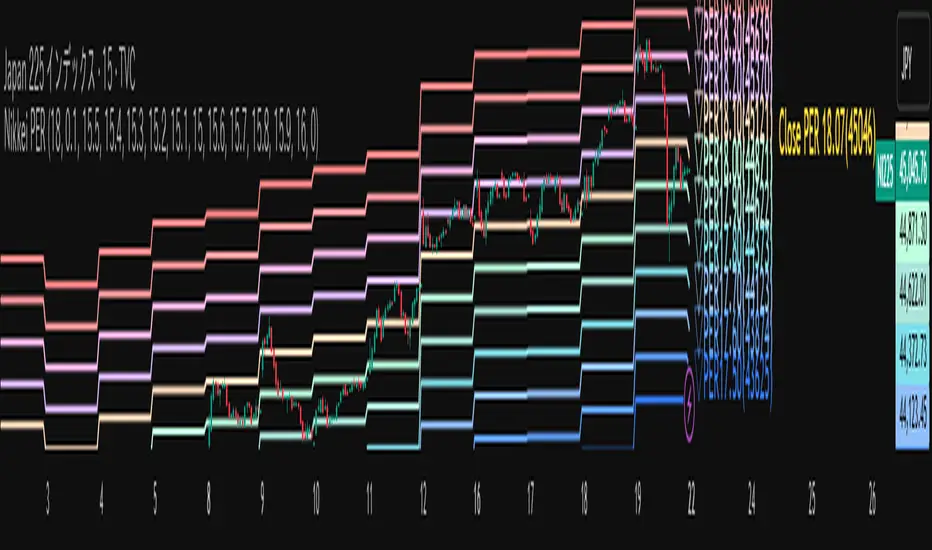
Nikkei PER Curve (EPS Text Area Input)
[Purpose]
This indicator visualizes the PER levels of the Nikkei 225 based on the dates and EPS data entered in the text area.
By plotting multiple PER multiplier lines, it helps users to understand the following:
Potential support and resistance levels based on PER multipliers
Comparison between the current stock price and theoretical valuation levels
Observation of PER trends and detection of deviations from standard valuation levels
[Usage / How to Use]
Trading Decisions:
When the stock price approaches a specific PER line, it can serve as a reference for support or resistance.
During intraday chart analysis, PER lines are drawn based on the most recent EPS, making them useful as reference levels even during market hours.
Valuation Analysis:
On daily charts, it helps to assess whether the Nikkei is overvalued or undervalued compared to historical levels, or to identify changes in valuation levels.
Risk Management:
The theoretical price lines based on PER can be used as reference points for stop-loss or profit-taking decisions.
Simple Data Input:
EPS data is entered in a text area, one line per date, in comma-separated format:
YYYY/MM/DD,EPS
YYYY/MM/DD,EPS
Multiple entries can be input by using line breaks between each date.
Note: Dates for which no candlestick exists in the chart will not be displayed.
This allows easy updating of PER lines without complex spreadsheets or external tools.
[Contents / Features]
EPS Data Input: Manual input of date and EPS via the text area; supports multiple data entries.
PER Multiplier Lines:
For evenly spaced lines, simply set the central multiplier and the interval between lines. The indicator automatically generates 11 lines (center ±5 lines).
For non-even spacing or individual multiplier settings, you can choose [Manual Setting] to adjust each line.
Close PER Labels: Displays the PER of the close price relative to the current EPS.
Timeframe Limitation: Use on daily charts (1D) or lower. PER lines cannot be displayed on higher timeframes.
Label Customization: Allows adjustment of text size, color, and position.
[Logic / How It Works]
EPS Parsing: The indicator reads the input text area line by line, splitting each line by a comma to obtain the date and EPS value.
Data Storage: The dates and EPS values are stored in arrays. These arrays allow the script to efficiently look up the latest EPS for any given date.
PER Calculation: For each chart bar, the indicator calculates the theoretical price for multiple PER multipliers using the formula:
Theoretical Price = EPS × PER multiplier
Line Plotting: PER lines are drawn at these calculated price levels. Labels are optionally displayed for the close price PER.
Date Matching: If a date from the EPS data does not exist as a candlestick on the chart, the corresponding PER line is not plotted.
[Cautions / Notes]
PER lines are theoretical values: They serve as psychological reference points and do not always act as true support or resistance.
Market Conditions: Lines may be broken depending on market circumstances.
Accuracy of EPS Data: Be careful with EPS input errors, as incorrect data will result in incorrect PER curves.
Input Format: Dates and EPS must be correctly comma-separated and entered one per line. Dates with no corresponding candlestick on the chart will not be plotted. Incorrect formatting may prevent lines from displaying.
Reliability: No method guarantees success in trading; use in combination with backtesting and other technical analysis tools.
[使用目的]
このインジケータは、入力した日付とEPSデータを基に日経225のPER水準を視覚化するものです
複数のPER倍率ラインを描画することで、以下を把握するのに役立ちます:
PER倍率に基づく潜在的なサポート・レジスタンス水準や目安
現在の株価と理論上の評価水準との比較
過去から現在までのPER推移の観察
[活用方法]
トレード判断:
株価が特定の倍率のPERラインに近づいたとき、抵抗や支持の目安としての活用
日中足表示時は、前日(最新日)のEPSに基づいたPERラインを表示するように作成しているので、場中でも参考目安として使用可能
評価分析:
過去の推移と比較して日経が割高か割安か、またはPER評価水準が変化したかの確認
リスク管理:
PERに基づく理論価格ラインを、損切りや利確の目安としての利用
[内容 / 機能]
簡単なデータ入力:
EPSデータはテキストエリアに手動入力。1行につき1日付・EPSをカンマ区切りで記入します
例
2025/09/19,2492.85
2025/09/18,2497.43
行を改行することで複数データ入力が可能
注意: チャート上にローソク足が存在しない日付のデータは表示されません
表計算や外部ツールを使わずに倍率を掛けたPERラインの作成・更新が簡単に行える
PER倍率ライン:
等間隔ラインの場合、中心倍率と各ラインの間隔を設定するだけで、自動的に中心値±5本、計11本のラインを作成
等間隔以外や個別設定したい場合は[手動設定]で調整可能
終値PERラベル: 現在のEPSに対する終値PERを表示
時間足制限: 日足(1日足)以下で使用すること。高い時間足ではPERラインは表示できません
ラベルカスタマイズ: 文字サイズ、色、位置を調整可能
[ロジック / 処理の流れ]
EPSデータの読み取り: 改行を検知し1日分のデータとして識別し、カンマで分割して日付とEPS値を取得
配列への格納: 日付とEPSを配列に格納し、各バーに対して最新のEPSを参照できるようにする
PER計算: 各バーに対して、以下の式で複数のPER倍率の理論価格を計算:
理論価格 = EPS × PER倍率
日付照合: EPSデータの日付がチャート上にローソク足として存在したら格納した配列からデータを取得。ローソク足が存在しない場合、そのPERラインは表示されない
ライン描画: 計算した価格にPERラインを描画。必要に応じて終値PERラベルも表示。
[注意事項]
PERラインは理論値であり心理的目安として機能することがありますが、必ずしも機能する訳ではない
その為、過去の検証や他のテクニカル指標と併用推奨
市況によってはラインを無視するように突破する可能性ことがある
EPSデータの入力ミスに注意すること。誤入力するとPER曲線が誤表示される
日付とEPSの入力は1行ずつ、正しい位置でカンマ区切りをいれること
ローソク足が存在しない日付のデータは正しく表示されないことがあるので注意
誤った入力形式ではラインが表示されない場合がある
نص برمجي مفتوح المصدر
بروح TradingView الحقيقية، قام مبتكر هذا النص البرمجي بجعله مفتوح المصدر، بحيث يمكن للمتداولين مراجعة وظائفه والتحقق منها. شكرا للمؤلف! بينما يمكنك استخدامه مجانًا، تذكر أن إعادة نشر الكود يخضع لقواعد الموقع الخاصة بنا.
إخلاء المسؤولية
لا يُقصد بالمعلومات والمنشورات أن تكون، أو تشكل، أي نصيحة مالية أو استثمارية أو تجارية أو أنواع أخرى من النصائح أو التوصيات المقدمة أو المعتمدة من TradingView. اقرأ المزيد في شروط الاستخدام.