OPEN-SOURCE SCRIPT
Power Zone Trader (PZT)
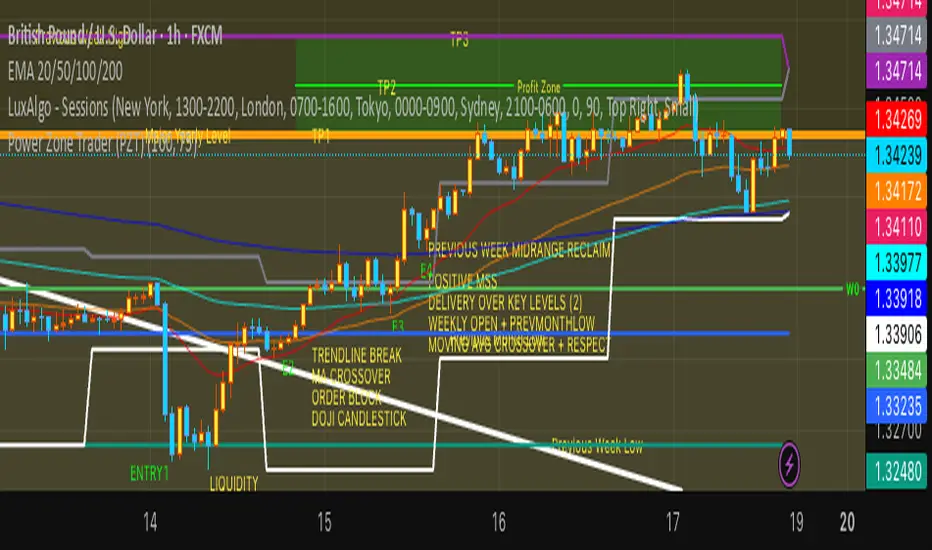
The PZT Indicator (Power Zone Trader ) is a multi-timeframe confluence system designed to identify and visualize natural support and resistance levels with exceptional clarity. By automatically mapping key structural highs and lows from higher timeframes, PZT allows traders to see where price is most likely to react, reverse, or accelerate, forming the foundation for high-probability trade setups. PZT highlights key reaction zones that influence order flow and trader behavior across all markets — including Forex, Crypto, Indices, and Commodities.
📍 Indicator Key
Each color represents a significant price level derived from its respective timeframe, helping traders instantly gauge market context and potential liquidity pools:
Color Level Represented Significance
🔴 Red Yearly High Strong resistance — potential selling pressure and major liquidity sweep zones.
🟢 Green Yearly Low Strong support — potential buying interest and accumulation points.
🟠 Orange Monthly High Intermediate resistance — swing rejection or continuation decision zone.
🔵 Blue Monthly Low Intermediate support — potential retracement or base-building area.
🟣 Purple Weekly High Short-term resistance — common rejection level or stop hunt zone.
🟤 Teal Weekly Low Short-term support — potential rebound or liquidity grab.
⚫ Gray Daily High Intraday resistance — active scalper and day trader interest.
⚪ White Daily Low Intraday support — short-term bounce or continuation pivot.
نص برمجي مفتوح المصدر
بروح TradingView الحقيقية، قام مبتكر هذا النص البرمجي بجعله مفتوح المصدر، بحيث يمكن للمتداولين مراجعة وظائفه والتحقق منها. شكرا للمؤلف! بينما يمكنك استخدامه مجانًا، تذكر أن إعادة نشر الكود يخضع لقواعد الموقع الخاصة بنا.
إخلاء المسؤولية
لا يُقصد بالمعلومات والمنشورات أن تكون، أو تشكل، أي نصيحة مالية أو استثمارية أو تجارية أو أنواع أخرى من النصائح أو التوصيات المقدمة أو المعتمدة من TradingView. اقرأ المزيد في شروط الاستخدام.