INVITE-ONLY SCRIPT
BKN ATR Trading Range

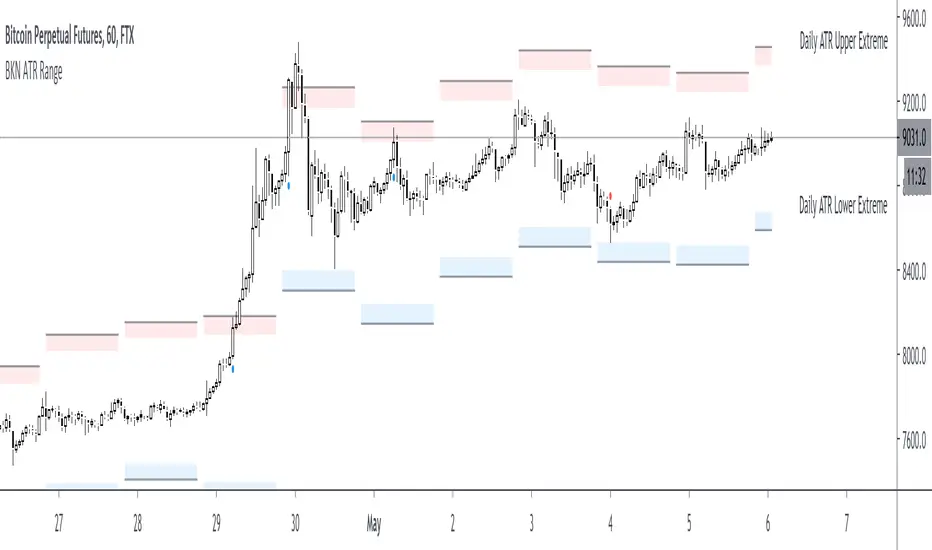
This script allows you to view ATR extremes based on the open of the candle. Average True Range gives you the average move of an asset during a period of time. If you're viewing the Daily timeframe , The Average True Range represents the average size of a move that occurs in a one day timespan over the specified period. Reaching the upper or lower boundary could signify that a trend is reaching exhaustion as the asset is reaching it's expected move for the period.
You can manually set a timeframe to use for the ATR value. By default, we are viewing a Daily timeframe . For lower timeframe trading you may want to look at the hourly or four hour ATR range.
You can manually set a timeframe to use for the ATR value. By default, we are viewing a Daily timeframe . For lower timeframe trading you may want to look at the hourly or four hour ATR range.
نص برمجي للمستخدمين المدعوين فقط
الوصول إلى هذا النص مقيد للمستخدمين المصرح لهم من قبل المؤلف وعادة ما يكون الدفع مطلوباً. يمكنك إضافته إلى مفضلاتك، لكن لن تتمكن من استخدامه إلا بعد طلب الإذن والحصول عليه من مؤلفه. تواصل مع ThePuma للحصول على مزيد من المعلومات، أو اتبع إرشادات المؤلف أدناه.
لا تقترح TradingView الدفع مقابل النصوص البرمجية واستخدامها حتى تثق بنسبة 100٪ في مؤلفها وتفهم كيفية عملها. في كثير من الحالات، يمكنك العثور على بديل جيد مفتوح المصدر مجانًا في نصوص مجتمع الخاصة بنا .
تعليمات المؤلف
″
هل تريد استخدام هذا النص البرمجي على الرسم البياني؟
تحذير: يرجى القراءة قبل طلب الوصول.
إخلاء المسؤولية
لا يُقصد بالمعلومات والمنشورات أن تكون، أو تشكل، أي نصيحة مالية أو استثمارية أو تجارية أو أنواع أخرى من النصائح أو التوصيات المقدمة أو المعتمدة من TradingView. اقرأ المزيد في شروط الاستخدام.