OPEN-SOURCE SCRIPT
تم تحديثه Candle Scale Comparison
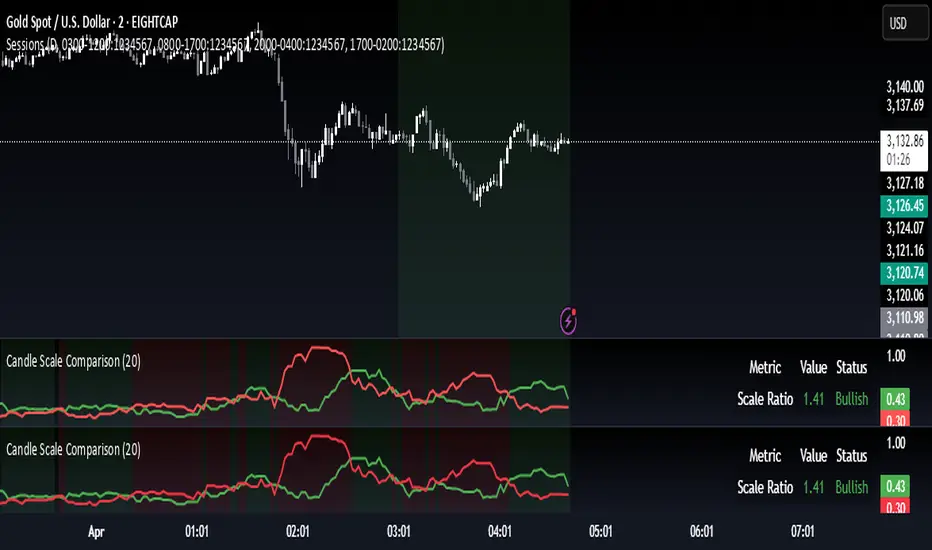
Compares the scale of bullish and bearish candles and shows which side is currently dominant. Works in any symbol.
1. Input Parameters:
- LookbackPeriod: Allows you to set how many bars to look back for calculating averages (default: 20)
- showLabels: Toggle to show/hide dominance labels on the chart
2. Calculations:
- Calculates the scale of bullish candles (close - open)
Calculates the scale of bearish candles (open - close)
- Computes moving averages for both scales using the specified lookback period
- Determines which type of candles are dominating based on the averages
3. Visual Elements:
- Plots two lines showing the average scales:
- Green line for bullish candle scales
- Red line for bearish candle scales
- Adds a background color that changes based on dominance:
- Light green when bullish candles dominate
- Light red when bearish candles dominate
- Shows labels above the chart indicating current dominance
- Displays a table in the top-right corner showing:
- The current scale ratio (bullish/bearish)
- The current dominance status
4. Features:
- The indicator is plotted in a separate pane below the main chart
- Uses color coding for easy visual interpretation
- Provides both visual and numerical representation of the dominance
- Updates in real-time as new candles form
ملاحظات الأخبار
Compares the scale of bullish and bearish candles and shows which side is currently dominant. Works in any symbol.1. Input Parameters:
- LookbackPeriod: Allows you to set how many bars to look back for calculating averages (default: 20)
- showLabels: Toggle to show/hide dominance labels on the chart
2. Calculations:
- Calculates the scale of bullish candles (close - open)
Calculates the scale of bearish candles (open - close)
- Computes moving averages for both scales using the specified lookback period
- Determines which type of candles are dominating based on the averages
3. Visual Elements:
- Plots two lines showing the average scales:
- Green line for bullish candle scales
- Red line for bearish candle scales
- Adds a background color that changes based on dominance:
- Light green when bullish candles dominate
- Light red when bearish candles dominate
- Shows labels above the chart indicating current dominance
- Displays a table in the top-right corner showing:
- The current scale ratio (bullish/bearish)
- The current dominance status
4. Features:
- The indicator is plotted in a separate pane below the main chart
- Uses color coding for easy visual interpretation
- Provides both visual and numerical representation of the dominance
- Updates in real-time as new candles form
نص برمجي مفتوح المصدر
بروح TradingView الحقيقية، قام مبتكر هذا النص البرمجي بجعله مفتوح المصدر، بحيث يمكن للمتداولين مراجعة وظائفه والتحقق منها. شكرا للمؤلف! بينما يمكنك استخدامه مجانًا، تذكر أن إعادة نشر الكود يخضع لقواعد الموقع الخاصة بنا.
إخلاء المسؤولية
لا يُقصد بالمعلومات والمنشورات أن تكون، أو تشكل، أي نصيحة مالية أو استثمارية أو تجارية أو أنواع أخرى من النصائح أو التوصيات المقدمة أو المعتمدة من TradingView. اقرأ المزيد في شروط الاستخدام.