OPEN-SOURCE SCRIPT
Candle Volatilty Indicator
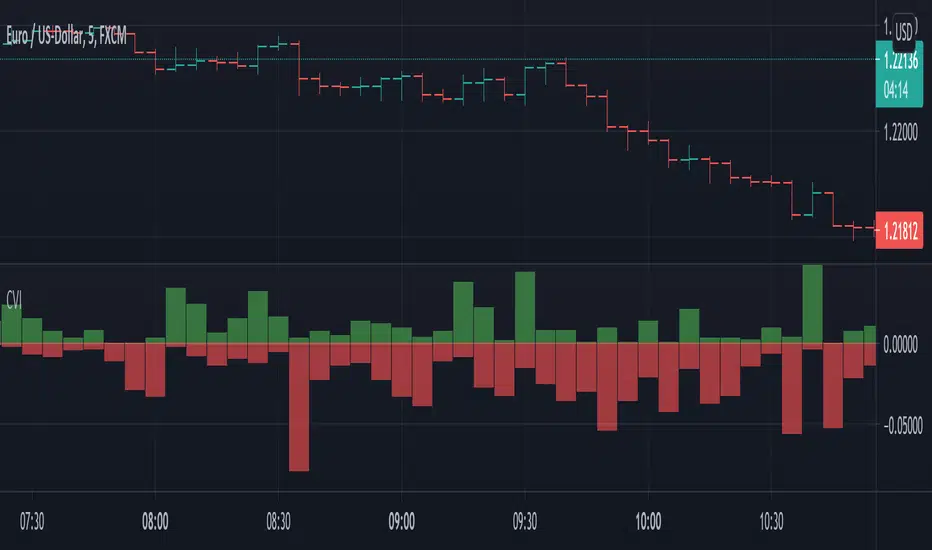
This script helps to get a better view on the volatility of the price.
Each bar represents the high and low of the candle calculated derived from the open price.
It can help to get an insight on the volatility .
Each bar represents the high and low of the candle calculated derived from the open price.
It can help to get an insight on the volatility .
نص برمجي مفتوح المصدر
بروح TradingView الحقيقية، قام مبتكر هذا النص البرمجي بجعله مفتوح المصدر، بحيث يمكن للمتداولين مراجعة وظائفه والتحقق منها. شكرا للمؤلف! بينما يمكنك استخدامه مجانًا، تذكر أن إعادة نشر الكود يخضع لقواعد الموقع الخاصة بنا.
إخلاء المسؤولية
لا يُقصد بالمعلومات والمنشورات أن تكون، أو تشكل، أي نصيحة مالية أو استثمارية أو تجارية أو أنواع أخرى من النصائح أو التوصيات المقدمة أو المعتمدة من TradingView. اقرأ المزيد في شروط الاستخدام.