PROTECTED SOURCE SCRIPT
تم تحديثه Sessions and Market Structure Highs and Lows
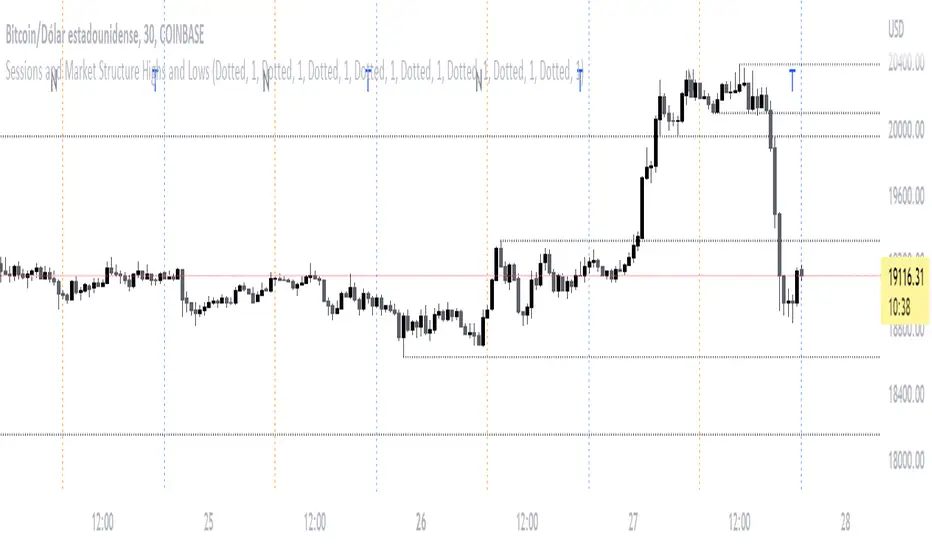
This Indicator has the purpose that traders can see the opening of the different sessions on the chart in a clean and visually pleasing way.
By adding the script to your chart, vertical lines will automatically appear at the specific opening hours of each session
What schedules are used by the Script?
Keep in mind that the style of the line can be modified from the indicator settings, by the way in case you do not want to see the main letter of each session on the chart, you can also deactivate it from the settings
Also, in a very entertaining way, you will be able to see the Highs and Lows of the corresponding temporalities.
By adding the script to your chart, vertical lines will automatically appear at the specific opening hours of each session
What schedules are used by the Script?
- The New York session starts at 07:30 GMT and its line will be represented by the color Orange
- Then for the London session the start is plotted at 03:30 GMT with the Gray line
- And finally the Asia/Tokyo session at 19:00 GMT with its Blue color line
Keep in mind that the style of the line can be modified from the indicator settings, by the way in case you do not want to see the main letter of each session on the chart, you can also deactivate it from the settings
Also, in a very entertaining way, you will be able to see the Highs and Lows of the corresponding temporalities.
ملاحظات الأخبار
You can define open sessions timeنص برمجي محمي
تم نشر هذا النص البرمجي كمصدر مغلق. ومع ذلك، يمكنك استخدامه بحرية ودون أي قيود - تعرف على المزيد هنا.
إخلاء المسؤولية
لا يُقصد بالمعلومات والمنشورات أن تكون، أو تشكل، أي نصيحة مالية أو استثمارية أو تجارية أو أنواع أخرى من النصائح أو التوصيات المقدمة أو المعتمدة من TradingView. اقرأ المزيد في شروط الاستخدام.
نص برمجي محمي
تم نشر هذا النص البرمجي كمصدر مغلق. ومع ذلك، يمكنك استخدامه بحرية ودون أي قيود - تعرف على المزيد هنا.
إخلاء المسؤولية
لا يُقصد بالمعلومات والمنشورات أن تكون، أو تشكل، أي نصيحة مالية أو استثمارية أو تجارية أو أنواع أخرى من النصائح أو التوصيات المقدمة أو المعتمدة من TradingView. اقرأ المزيد في شروط الاستخدام.