OPEN-SOURCE SCRIPT
تم تحديثه Elgrand - Overbought/sold Rsi + Stochastic zones
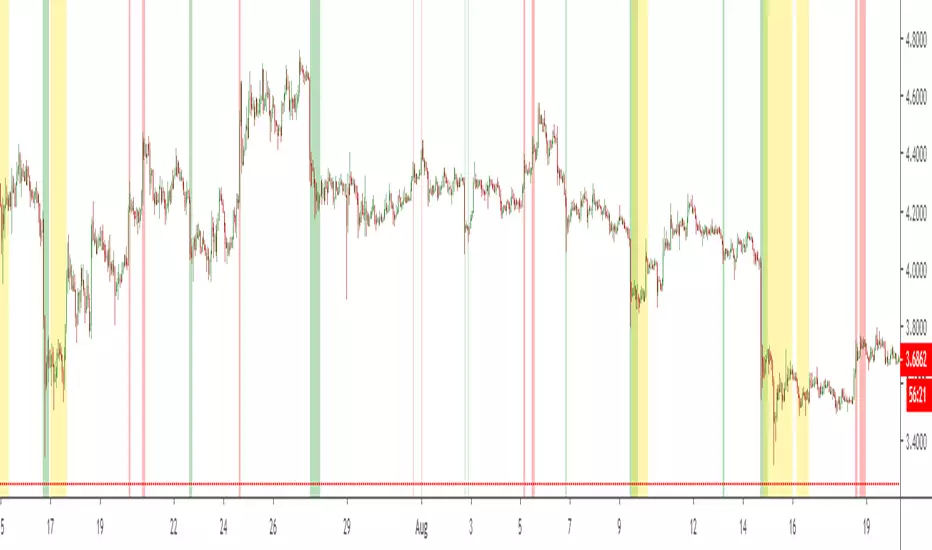
Visualize on your chart when price in an oversold or overbought zone. A combination of Rsi and Stochasticrsi is used for higher probability. Wait for an zone to be displayed and then wait for price to exit a zone. Once this happens check candlestick patterns and support/resistance "lines" to find appropiate stoplosses for you entry or exit
ملاحظات الأخبار
Update :- Upgraded to use version 4 of Pinescript
Added and extra timeframe which will show in yellow on your chart : this way you can decide to enter exit if 1H overbought/oversold is also happening on the 4H timeframe. Idea is that this will lower your entry/exit risk.
Todo :
- Make the parent timeframe display optional
Be able to choose per timeframe which parent timeframe you would like to use
نص برمجي مفتوح المصدر
بروح TradingView الحقيقية، قام مبتكر هذا النص البرمجي بجعله مفتوح المصدر، بحيث يمكن للمتداولين مراجعة وظائفه والتحقق منها. شكرا للمؤلف! بينما يمكنك استخدامه مجانًا، تذكر أن إعادة نشر الكود يخضع لقواعد الموقع الخاصة بنا.
إخلاء المسؤولية
لا يُقصد بالمعلومات والمنشورات أن تكون، أو تشكل، أي نصيحة مالية أو استثمارية أو تجارية أو أنواع أخرى من النصائح أو التوصيات المقدمة أو المعتمدة من TradingView. اقرأ المزيد في شروط الاستخدام.