OPEN-SOURCE SCRIPT
تم تحديثه ChangeTrend [kingthies_]
% X Change Over Y Amount of Time
AKA "ChangeTrend"
Published by user Eric Thies [kingthies_] on 9/3/2020
Description
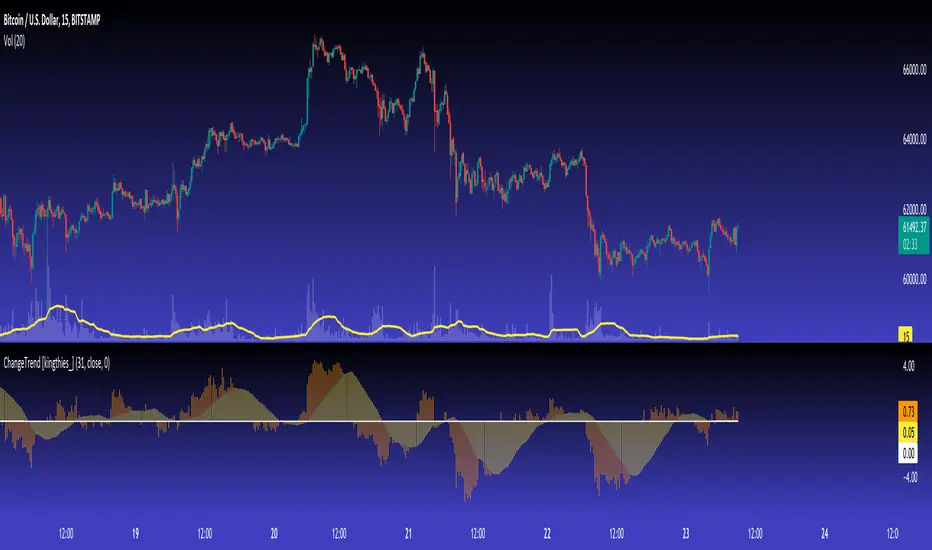
Relatively simple script that is measuring the performance of the input over the previous y # bars.
The EMA appears to make troughs and peaks easy to see coming / look at as they happen.
Interpretation:
Cheers,
AKA "ChangeTrend"
Published by user Eric Thies [kingthies_] on 9/3/2020
Description
Relatively simple script that is measuring the performance of the input over the previous y # bars.
The EMA appears to make troughs and peaks easy to see coming / look at as they happen.
Interpretation:
- Orange Histogram Represents the immediate % Change
- Yellow Histogram represents the overall trend of such as an SMA of the same Y # of bars.
Cheers,
ملاحظات الأخبار
Upgraded to pine v5نص برمجي مفتوح المصدر
بروح TradingView الحقيقية، قام مبتكر هذا النص البرمجي بجعله مفتوح المصدر، بحيث يمكن للمتداولين مراجعة وظائفه والتحقق منها. شكرا للمؤلف! بينما يمكنك استخدامه مجانًا، تذكر أن إعادة نشر الكود يخضع لقواعد الموقع الخاصة بنا.
Eric Thies
إخلاء المسؤولية
لا يُقصد بالمعلومات والمنشورات أن تكون، أو تشكل، أي نصيحة مالية أو استثمارية أو تجارية أو أنواع أخرى من النصائح أو التوصيات المقدمة أو المعتمدة من TradingView. اقرأ المزيد في شروط الاستخدام.
نص برمجي مفتوح المصدر
بروح TradingView الحقيقية، قام مبتكر هذا النص البرمجي بجعله مفتوح المصدر، بحيث يمكن للمتداولين مراجعة وظائفه والتحقق منها. شكرا للمؤلف! بينما يمكنك استخدامه مجانًا، تذكر أن إعادة نشر الكود يخضع لقواعد الموقع الخاصة بنا.
Eric Thies
إخلاء المسؤولية
لا يُقصد بالمعلومات والمنشورات أن تكون، أو تشكل، أي نصيحة مالية أو استثمارية أو تجارية أو أنواع أخرى من النصائح أو التوصيات المقدمة أو المعتمدة من TradingView. اقرأ المزيد في شروط الاستخدام.