Sa-guru Indicator
Class: trend indicator
Type of trading: intraday
Time frame: 1H – 4H
Purpose: detection of trend activation points
Level of aggressiveness: standard
"Sa-guru" indicator is designed to detection of trend activation points. For this purposes, a double signal block is incorporated in its structure: the first determines the medium-term market sentiment to the asset; the second is responsible for assessing the current market sentiment.
Based on the results of the trend analysis, using the author's approach to determination of the activation of the current trend movement moment, the “Sa-guru” indicator generates buy / sell signals and display them on the price chart. In addition, to ease the trading process, the indicator also calculates the optimal values of take profits and stop losses for the trade based on a unique author's approach.
The optimal time frames for the indicator with the default settings are 1 hour and 4 hours (!!!).
Structure of the indicator
Indicator consists of the following elements:
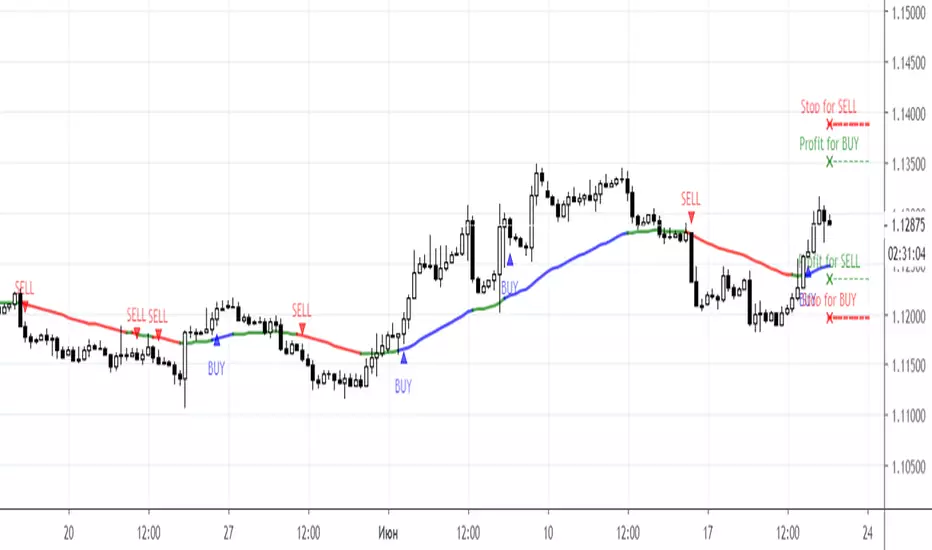
- signal line – is designed for color indication of the current dominant tendency. If the color of the signal line is red, it means that the downward trend prevails, blue is for upward, and green is for flat. Accordingly, the trader should adjust his/her actions based on this information: search for sell opportunities and not buy if the line is red; search for purchases and not sell if the line is blue.
- trading signals (indicated by blue or red triangles depending on the type of signals with additional text identification) - are intended for color indication of the fact that the price has reached the optimal value for opening a position. The blue color of the triangle with the text "Buy" is a buy signal. Red color with the text "Sell" - a signal to sell.
- stop/profit levels (indicated by dotted lines with corresponding color identification and text labels) - are designed to display the optimal values of take profits (green dotted lines with corresponding text markers) and stop loss (red dotted lines with corresponding text markers) for the trade.
Parameters of the indicator
To configure the indicator, the following parameters are provided:
- Trendline period (default value - 44) - period for determining the medium-term trend. The higher the value is, the more conservative the perception indicator of a trend will be.
- Trend period (default value - 13) - period to determine the current trend. Responsible for the level of trade aggressiveness. The lower the value of this parameter, the more signals the indicator will generate and vice versa.
- Error in pips (default value is 1) - this parameter is used to control the frequency of the signals. The lower it is, the more signals the indicator will generate.
- Level period (default value - 21) – this parameter is used for calculating the values of profits and stops.
Rules of trading
The main task of the trader when working with this indicator is to monitor the color of the signal line. Green is a warning signal that a “buy” or “sell” signal will be generated soon. Accordingly, a change of color from green to red is a “sell” signal, and from green to blue is a “buy” signal.
Position can be held either until there are contraindications or till stop-loss/take-profit will be executed. For example, if there is a buy position, and the signal line changes color to red, then the position is closed forcibly, despite the fact that the values of stops or profits were not reached. In other cases, positions are closed by stops or profits, which were indicated on the chart at the time of the trade opening
In addition, positions can be closed in positive territory at the moments of maximum divergence between the current price and the signal line.
نص برمجي للمستخدمين المدعوين فقط
يمكن فقط للمستخدمين الذين تمت الموافقة عليهم من قبل المؤلف الوصول إلى هذا البرنامج النصي. ستحتاج إلى طلب الإذن والحصول عليه لاستخدامه. يتم منح هذا عادةً بعد الدفع. لمزيد من التفاصيل، اتبع تعليمات المؤلف أدناه أو اتصل Trade24Fx مباشرة.
لا توصي TradingView بالدفع مقابل برنامج نصي أو استخدامه إلا إذا كنت تثق تمامًا في مؤلفه وتفهم كيفية عمله. يمكنك أيضًا العثور على بدائل مجانية ومفتوحة المصدر في نصوص مجتمعنا.
تعليمات المؤلف
bit.ly/2oBvkHY
Больше информации на нашем ютьюб-канале
youtube.com/channel/UCYEOurJfasXWyYnrriGwsqQ
إخلاء المسؤولية
نص برمجي للمستخدمين المدعوين فقط
يمكن فقط للمستخدمين الذين تمت الموافقة عليهم من قبل المؤلف الوصول إلى هذا البرنامج النصي. ستحتاج إلى طلب الإذن والحصول عليه لاستخدامه. يتم منح هذا عادةً بعد الدفع. لمزيد من التفاصيل، اتبع تعليمات المؤلف أدناه أو اتصل Trade24Fx مباشرة.
لا توصي TradingView بالدفع مقابل برنامج نصي أو استخدامه إلا إذا كنت تثق تمامًا في مؤلفه وتفهم كيفية عمله. يمكنك أيضًا العثور على بدائل مجانية ومفتوحة المصدر في نصوص مجتمعنا.
تعليمات المؤلف
bit.ly/2oBvkHY
Больше информации на нашем ютьюб-канале
youtube.com/channel/UCYEOurJfasXWyYnrriGwsqQ