OPEN-SOURCE SCRIPT
VixFix RVol + EMA
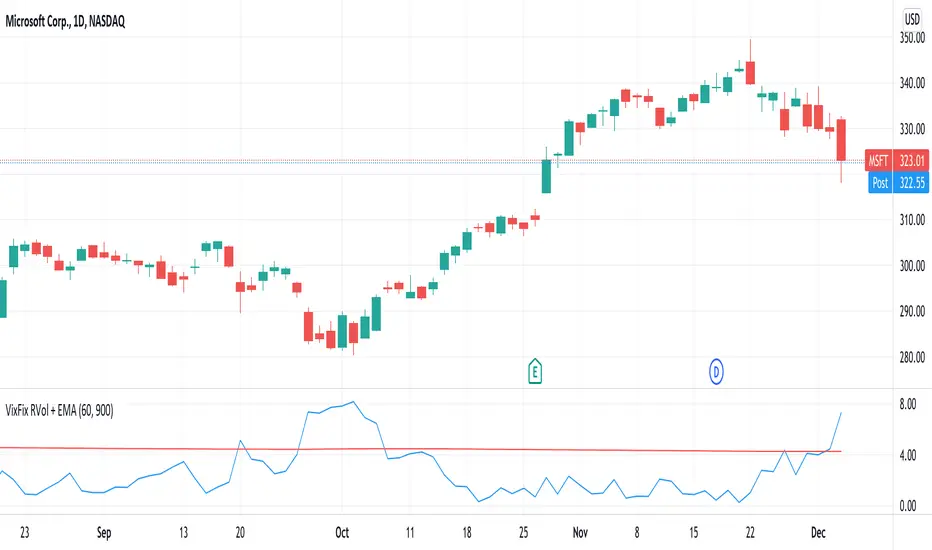
This indicator plots Realised Volatility (measured using VixFix method) against its long-term exponential moving average.
RVol breaking above its EMA = Sell signal
RVol breaking below its EMA = Buy signal
60-day VixFix look back period and 900 day EMA work well for lower volatility tickers (equity ETFs, megacap stocks). Higher volatility tickers could benefit from shorter look back period and EMA.
RVol breaking above its EMA = Sell signal
RVol breaking below its EMA = Buy signal
60-day VixFix look back period and 900 day EMA work well for lower volatility tickers (equity ETFs, megacap stocks). Higher volatility tickers could benefit from shorter look back period and EMA.
نص برمجي مفتوح المصدر
بروح TradingView الحقيقية، قام مبتكر هذا النص البرمجي بجعله مفتوح المصدر، بحيث يمكن للمتداولين مراجعة وظائفه والتحقق منها. شكرا للمؤلف! بينما يمكنك استخدامه مجانًا، تذكر أن إعادة نشر الكود يخضع لقواعد الموقع الخاصة بنا.
إخلاء المسؤولية
لا يُقصد بالمعلومات والمنشورات أن تكون، أو تشكل، أي نصيحة مالية أو استثمارية أو تجارية أو أنواع أخرى من النصائح أو التوصيات المقدمة أو المعتمدة من TradingView. اقرأ المزيد في شروط الاستخدام.