OPEN-SOURCE SCRIPT
Chop Zones

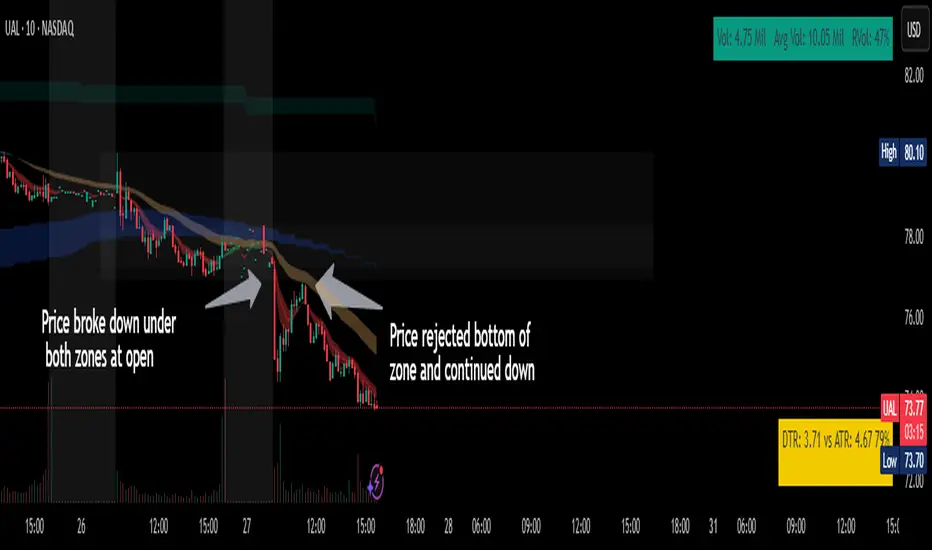
This indicator plots two "zones" in the form of shaded boxes, one between PMH and PML and one between PDH and PDL, the area that is shaded more has the highest probability of price action to be "choppy", the lesser shaded area has less probability for "choppy" action whilst outside the shaded areas there is high probability of a trend.
This indicator can be used to determine one of the three types of day:
Chop day
Bullish trend day
Bearish trend day
Chop day example today on SPY
SPY

Bullish trend day example on DLTR
DLTR

Bearish trend day example on UAL
UAL

This indicator can be used to determine one of the three types of day:
Chop day
Bullish trend day
Bearish trend day
Chop day example today on
Bullish trend day example on
Bearish trend day example on
نص برمجي مفتوح المصدر
بروح TradingView الحقيقية، قام مبتكر هذا النص البرمجي بجعله مفتوح المصدر، بحيث يمكن للمتداولين مراجعة وظائفه والتحقق منها. شكرا للمؤلف! بينما يمكنك استخدامه مجانًا، تذكر أن إعادة نشر الكود يخضع لقواعد الموقع الخاصة بنا.
إخلاء المسؤولية
لا يُقصد بالمعلومات والمنشورات أن تكون، أو تشكل، أي نصيحة مالية أو استثمارية أو تجارية أو أنواع أخرى من النصائح أو التوصيات المقدمة أو المعتمدة من TradingView. اقرأ المزيد في شروط الاستخدام.