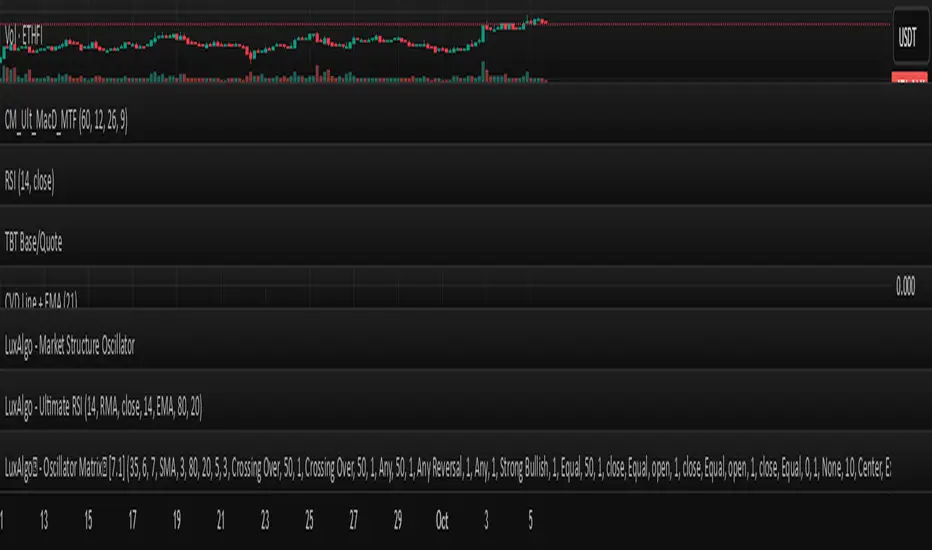
This indicator visualizes the Cumulative Volume Delta (CVD) as a line and overlays an Exponential Moving Average (EMA, default length 21) on the CVD. The CVD estimates buy/sell volume using candle direction, accumulating volume when price moves up or down. The EMA helps smooth the CVD, quickly signaling directional shifts that can indicate potential trend changes. The line turns green when CVD holds above its EMA (suggesting bullish pressure) and red when below (suggesting bearish pressure).
Settings allow users to customize the EMA period to suit different timeframes or trading strategies. The script is intended for educational purposes and is released under the Mozilla Public License 2.0. For best results, use in conjunction with other analysis and risk management tools.
نص برمجي للمستخدمين المدعوين فقط
يمكن فقط للمستخدمين الذين تمت الموافقة عليهم من قبل المؤلف الوصول إلى هذا البرنامج النصي. ستحتاج إلى طلب الإذن والحصول عليه لاستخدامه. يتم منح هذا عادةً بعد الدفع. لمزيد من التفاصيل، اتبع تعليمات المؤلف أدناه أو اتصل MFH_BM مباشرة.
لا توصي TradingView بالدفع مقابل برنامج نصي أو استخدامه إلا إذا كنت تثق تمامًا في مؤلفه وتفهم كيفية عمله. يمكنك أيضًا العثور على بدائل مجانية ومفتوحة المصدر في نصوص مجتمعنا.
تعليمات المؤلف
This indicator plots the Cumulative Volume Delta (CVD) and overlays an adjustable Exponential Moving Average (EMA, default length 21) on it.
Adjust the EMA length in the settings as needed for your timeframe or asset.
لا يُقصد بالمعلومات والمنشورات أن تكون، أو تشكل، أي نصيحة مالية أو استثمارية أو تجارية أو أنواع أخرى من النصائح أو التوصيات المقدمة أو المعتمدة من TradingView. اقرأ المزيد في شروط الاستخدام.