OPEN-SOURCE SCRIPT
Relative Strength Market Picker
Modified to code from modhelius and added colors and histogram for easy reading...thanks to him...
What is Relative Strength?
Relative strength is a ratio of a stock price performance to a market average (index) performance. It is used in technical analysis.
It is not to be confused with relative strength index.
To calculate the relative strength of a particular stock, divide the percentage change over some time period by the percentage change of a particular index over the same time period.
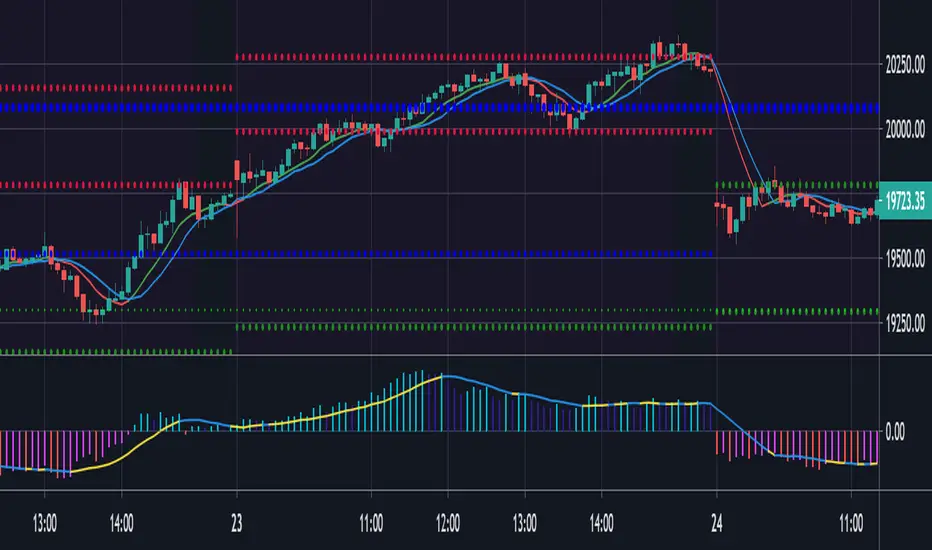
How to read this indicator for trading and decesion making?
There are four colors
Aqua: Shows the bullish momentum against the index of your choosing
Navy blue: Show the bearish momentum is weakning at the time period
Fuschsia : Shows the bullish gaining strength and about to cross zero line
Red: Shows the bearish momentum is strong.
Other indicators to be used along with this are
1. Pivot points
2. Moving Average of highs and lows -- 17 period
To take long calls --- There has to be high closing candle above the 17 period moving average of highs and there has to be bullish momentum and ideally with the pivot point as a support
To take short calls -- There has to low closing candle below the 17 period moving average of lows and there has to be bearish momentum and ideally with the pivot point as a resistance.


What is Relative Strength?
Relative strength is a ratio of a stock price performance to a market average (index) performance. It is used in technical analysis.
It is not to be confused with relative strength index.
To calculate the relative strength of a particular stock, divide the percentage change over some time period by the percentage change of a particular index over the same time period.
How to read this indicator for trading and decesion making?
There are four colors
Aqua: Shows the bullish momentum against the index of your choosing
Navy blue: Show the bearish momentum is weakning at the time period
Fuschsia : Shows the bullish gaining strength and about to cross zero line
Red: Shows the bearish momentum is strong.
Other indicators to be used along with this are
1. Pivot points
2. Moving Average of highs and lows -- 17 period
To take long calls --- There has to be high closing candle above the 17 period moving average of highs and there has to be bullish momentum and ideally with the pivot point as a support
To take short calls -- There has to low closing candle below the 17 period moving average of lows and there has to be bearish momentum and ideally with the pivot point as a resistance.
نص برمجي مفتوح المصدر
بروح TradingView الحقيقية، قام مبتكر هذا النص البرمجي بجعله مفتوح المصدر، بحيث يمكن للمتداولين مراجعة وظائفه والتحقق منها. شكرا للمؤلف! بينما يمكنك استخدامه مجانًا، تذكر أن إعادة نشر الكود يخضع لقواعد الموقع الخاصة بنا.
إخلاء المسؤولية
لا يُقصد بالمعلومات والمنشورات أن تكون، أو تشكل، أي نصيحة مالية أو استثمارية أو تجارية أو أنواع أخرى من النصائح أو التوصيات المقدمة أو المعتمدة من TradingView. اقرأ المزيد في شروط الاستخدام.