OPEN-SOURCE SCRIPT
4 Bar Fractal
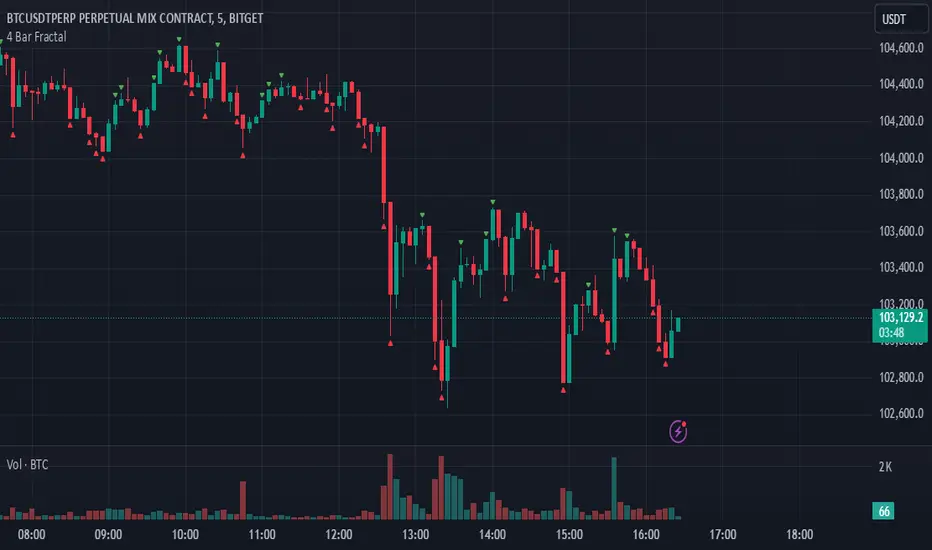
This indicator is a simple yet powerful tool that tracks potential trend reversals by checking whether the closing price of the last candle in a four-candle sequence finishes above or below the highs or lows of both the immediately preceding candle and the first candle in that sequence. If the closing price breaks above those prior highs, a green triangle appears above the chart to indicate bullish momentum; if it breaks below those lows, a red triangle appears below the chart to signal bearish momentum. Not only is it beneficial for scalping or other short-term trading, but it also works well for swing trades and longer-term trends, making it one of the most effective indicators for catching significant market shifts. However, to avoid false breakouts, it is advisable to confirm signals with volume or additional trend indicators and to maintain disciplined risk management.
نص برمجي مفتوح المصدر
بروح TradingView الحقيقية، قام مبتكر هذا النص البرمجي بجعله مفتوح المصدر، بحيث يمكن للمتداولين مراجعة وظائفه والتحقق منها. شكرا للمؤلف! بينما يمكنك استخدامه مجانًا، تذكر أن إعادة نشر الكود يخضع لقواعد الموقع الخاصة بنا.
إخلاء المسؤولية
لا يُقصد بالمعلومات والمنشورات أن تكون، أو تشكل، أي نصيحة مالية أو استثمارية أو تجارية أو أنواع أخرى من النصائح أو التوصيات المقدمة أو المعتمدة من TradingView. اقرأ المزيد في شروط الاستخدام.