OPEN-SOURCE SCRIPT
Bar Bodies [vnhilton]
Note: Go to "Chart Settings" & hide "Body" & "Borders". Also uncheck "Labels on price scale" & "Values in status line" as they're not needed.
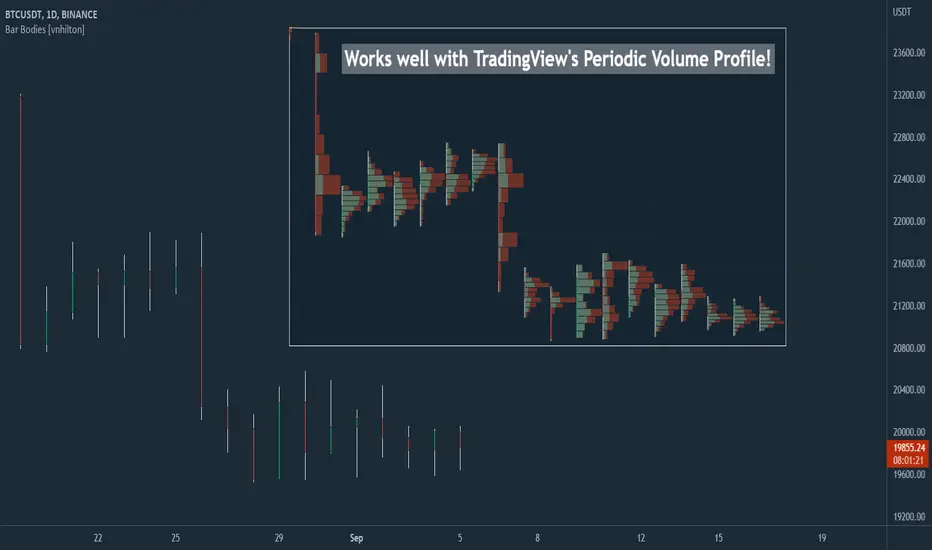
This script plots candlestick bodies with the same thickness as the wicks (similar to the bar chart, but without the horizontal lines to represent the open & close). To do this, it plots an invisible candlestick body with an invisible candlestick border from the high to the close/open for a green/red candle respectively, & uses the low wick as the candlestick body itself by plotting it from the low price to the open/close for a green/red candle respectively.
My personal use for this script is to use it in conjunction with TradingView's Periodic Volume Profile, in order to still see OHLC data without obstructing the candlesticks' volume profiles, as seen in the chart snapshot image above.
نص برمجي مفتوح المصدر
بروح TradingView الحقيقية، قام مبتكر هذا النص البرمجي بجعله مفتوح المصدر، بحيث يمكن للمتداولين مراجعة وظائفه والتحقق منها. شكرا للمؤلف! بينما يمكنك استخدامه مجانًا، تذكر أن إعادة نشر الكود يخضع لقواعد الموقع الخاصة بنا.
إخلاء المسؤولية
لا يُقصد بالمعلومات والمنشورات أن تكون، أو تشكل، أي نصيحة مالية أو استثمارية أو تجارية أو أنواع أخرى من النصائح أو التوصيات المقدمة أو المعتمدة من TradingView. اقرأ المزيد في شروط الاستخدام.