OPEN-SOURCE SCRIPT
تم تحديثه Custom Buy and Sell Signal with Body Ratio and RSI
Indicator Overview:
Name: Custom Buy and Sell Signal with Body Ratio and RSI
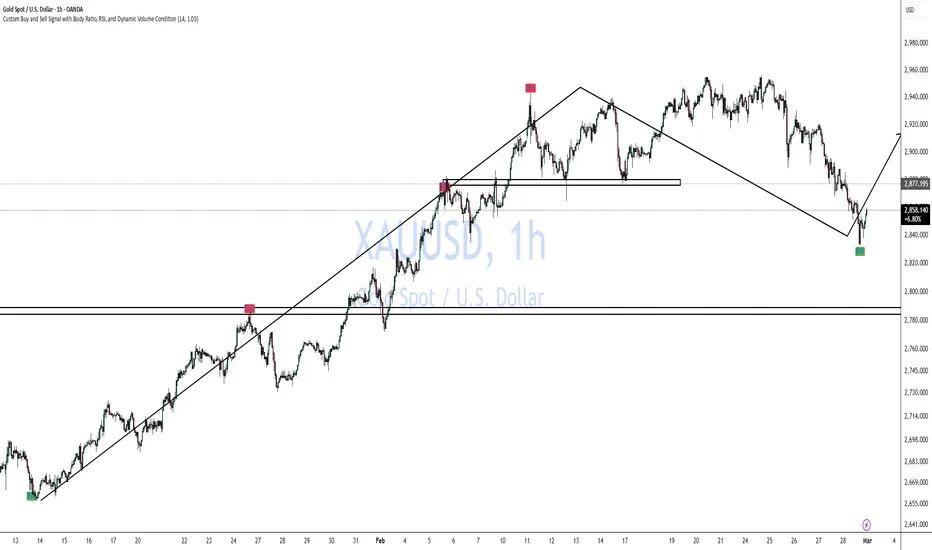
Description: This indicator is designed to detect buy and sell opportunities by analyzing the body size and wicks of candles in combination with the RSI indicator and volume. It helps identify trend reversals under high-volume market conditions, which enhances the reliability of the signals.
Indicator Features:
RSI (Relative Strength Index): The RSI indicator is used to assess oversold (RSI < 40) or overbought (RSI > 60) conditions. These zones signal potential reversals when combined with other technical signals.
Candle Body Analysis:
The indicator compares the size of the current and previous candles to validate signals.
For a buy signal, the current candle must be bullish and have a body size proportional to that of the previous bearish candle.
Similarly, for a sell signal, the current candle must be bearish with a body size comparable to the previous bullish candle.
Wick Validation:
The indicator analyzes the wick length to reinforce or exclude signals.
For a buy signal, the lower wick of the bullish candle must be shorter than that of the previous bearish candle.
For a sell signal, the upper wick of the bearish candle must be shorter than that of the previous bullish candle and smaller than 30% of the candle's body.
High Volume:
Signals are only generated when the volume exceeds a certain threshold, ensuring that signals are issued in active market conditions.
The minimum volume should be adjusted based on the asset. For example, for gold, a minimum volume of 9000 is recommended.
Trading Strategy:
Buy Signals:
A bearish (red) candle is followed by a bullish (green) candle with a body size that is comparable to the previous candle (0.9 to 3 times the body size).
The lower wick of the bullish candle is shorter than that of the previous bearish candle, confirming the validity of the signal.
The RSI must be below 40, indicating an oversold condition.
The volume must exceed the defined threshold (e.g., > 9000 for gold) to confirm an active market.
Sell Signals:
A bullish (green) candle is followed by a bearish (red) candle with a comparable body size.
The upper wick of the bearish candle must be shorter than that of the previous bullish candle and must not exceed 30% of the body size.
The RSI must be above 60, indicating an overbought condition.
The volume must also exceed the minimum threshold for a valid signal.
Usage Guidelines:
Volume Adjustment: It is crucial to adjust the volume threshold depending on the asset you're trading. For example, for assets like gold, a minimum volume of 9000 is recommended to filter out weak signals. Each asset has a different volume dynamic, so test different thresholds on historical data to find the optimal setting.
Time Frame:
It is recommended to use this indicator on a 1-hour (1H) chart for the best signal relevance. This time frame provides a good balance between reactivity and filtering false signals.
Confluence:
Combine the signals from this indicator with other tools like support and resistance levels, moving averages, or chart patterns to increase your chances of success. Confluence of indicators improves the reliability of signals.
Risk Management:
Implement strict risk management. Use stop-losses based on volatility, such as ATR (Average True Range), or the wick size to determine exit points.
Backtesting:
Before using it live, conduct backtesting on various assets to fine-tune the parameters, especially the volume threshold, and to verify performance across different market conditions.
This indicator is an excellent tool for traders looking to identify trend reversals based on solid technical criteria such as RSI, candle structure, and volume. It is particularly effective on volatile assets with precise volume adjustment.
ملاحظات الأخبار
Indicator Name: Buy and Sell Signals by Imane-AcademyDescription:
This indicator is similar to the Custom Buy and Sell Signal with Body Ratio and RSI, but with an additional feature: it automatically calculates the volume condition. This makes it extremely useful for traders who want buy and sell signals based on specific candlestick patterns without manually adjusting volume conditions.
The indicator works on any timeframe, whether you are scalping, intraday trading, or swing trading. It adapts to different market conditions, offering complete flexibility.
Key Features:
Candlestick Analysis:
Identifies bullish and bearish candlestick patterns based on the current candlestick body size compared to the previous one.
Verifies wick sizes to validate buy and sell conditions.
RSI (Relative Strength Index):
Uses the RSI to confirm overbought and oversold zones.
Buy condition when the RSI is below 40.
Sell condition when the RSI is above 60.
Automatic Dynamic Volume:
This indicator automatically calculates the volume condition to validate signals by comparing the current candle's volume to the previous one, removing the need to manually adjust this condition.
Buy/Sell Signals:
Generates a BUY signal when a bullish candle follows a bearish candle, and the body, wick, RSI, and volume conditions are met.
Generates a SELL signal when a bearish candle follows a bullish candle, under the same criteria.
How to Use:
Buy Signals (BUY):
A green arrow will appear below a candle when buy conditions are met.
Sell Signals (SELL):
A red arrow will appear above a candle when sell conditions are met.
This indicator is designed to work on all timeframes, from the shortest to the longest. It is particularly effective in volatile markets due to its automatic volume validation feature, which filters false signals and improves the accuracy of generated signals.
Important Advice:
It is crucial to follow a solid trading plan when using this indicator. Good money management is essential to limit losses and protect your capital. Remember that signals, no matter how accurate, should always be used in conjunction with a well-structured trading plan. Always adjust your position sizes and set stop-losses and take-profits based on your risk tolerance.
Adjustable Parameters:
RSI Length: Allows you to set the length of the period for the RSI calculation (default: 14).
The Buy and Sell Signals by Imane-Academy indicator is a versatile tool that adapts to all trading styles. With its reliable signals and automatically calculated dynamic volume, it helps you make informed decisions, no matter the timeframe you are trading on. Always ensure you follow proper risk management and money management to maximize gains and minimize losses.
ملاحظات الأخبار
Description:This indicator is similar to the Custom Buy and Sell Signal with Body Ratio and RSI, but with an additional feature: it automatically calculates the volume condition. This makes it extremely useful for traders who want buy and sell signals based on specific candlestick patterns without manually adjusting volume conditions.
The indicator works on any timeframe, whether you are scalping, intraday trading, or swing trading. It adapts to different market conditions, offering complete flexibility.
Key Features:
Candlestick Analysis:
Identifies bullish and bearish candlestick patterns based on the current candlestick body size compared to the previous one.
Verifies wick sizes to validate buy and sell conditions.
RSI (Relative Strength Index):
Uses the RSI to confirm overbought and oversold zones.
Buy condition when the RSI is below 40.
Sell condition when the RSI is above 60.
Automatic Dynamic Volume:
This indicator automatically calculates the volume condition to validate signals by comparing the current candle's volume to the previous one, removing the need to manually adjust this condition.
Buy/Sell Signals:
Generates a BUY signal when a bullish candle follows a bearish candle, and the body, wick, RSI, and volume conditions are met.
Generates a SELL signal when a bearish candle follows a bullish candle, under the same criteria.
How to Use:
Buy Signals (BUY):
A green arrow will appear below a candle when buy conditions are met.
Sell Signals (SELL):
A red arrow will appear above a candle when sell conditions are met.
This indicator is designed to work on all timeframes, from the shortest to the longest. It is particularly effective in volatile markets due to its automatic volume validation feature, which filters false signals and improves the accuracy of generated signals.
Important Advice:
It is crucial to follow a solid trading plan when using this indicator. Good money management is essential to limit losses and protect your capital. Remember that signals, no matter how accurate, should always be used in conjunction with a well-structured trading plan. Always adjust your position sizes and set stop-losses and take-profits based on your risk tolerance.
Adjustable Parameters:
RSI Length: Allows you to set the length of the period for the RSI calculation (default: 14).
The Buy and Sell Signals by Imane-Academy indicator is a versatile tool that adapts to all trading styles. With its reliable signals and automatically calculated dynamic volume, it helps you make informed decisions, no matter the timeframe you are trading on. Always ensure you follow proper risk management and money management to maximize gains and minimize losses.
نص برمجي مفتوح المصدر
بروح TradingView الحقيقية، قام مبتكر هذا النص البرمجي بجعله مفتوح المصدر، بحيث يمكن للمتداولين مراجعة وظائفه والتحقق منها. شكرا للمؤلف! بينما يمكنك استخدامه مجانًا، تذكر أن إعادة نشر الكود يخضع لقواعد الموقع الخاصة بنا.
إخلاء المسؤولية
لا يُقصد بالمعلومات والمنشورات أن تكون، أو تشكل، أي نصيحة مالية أو استثمارية أو تجارية أو أنواع أخرى من النصائح أو التوصيات المقدمة أو المعتمدة من TradingView. اقرأ المزيد في شروط الاستخدام.