OPEN-SOURCE SCRIPT
Three Candle Rolling Pivot Range

**Strategy Description: Three Previous Candle Rolling Pivot Range**
**Introduction:**
This trading strategy is based on the concept of the rolling pivot range calculated from the high, low, and close prices of the three previous candles. The rolling pivot range serves as a dynamic support and resistance level, and this strategy aims to capture potential trading opportunities based on the price relationship with this range.
**Strategy Components:**
**1. Rolling Pivot Range Calculation:**
- **Rolling Pivot:** Calculate the rolling pivot by averaging the high, low, and close prices of the three previous candles.
- **Second Number:** Find the midpoint between the high and low of the three previous candles.
- **Pivot Differential:** Measure the difference between the rolling pivot and the second number.
- **Rolling Pivot Range High:** Set as rolling pivot + pivot differential.
- **Rolling Pivot Range Low:** Set as rolling pivot - pivot differential.
**2. Entry Rules:**
- **Long Entry:**
- Initiate a long entry when the current close is above both the rolling pivot range high and the rolling pivot.
- Continue the long entry as long as both the rolling pivot range high and low are higher than the corresponding values of the previous candle.
- **Short Entry:**
- Start a short entry when the current close is below both the rolling pivot range high and the rolling pivot.
- Continue the short entry as long as both the rolling pivot range high and low are lower than the corresponding values of the previous candle.
**Visualization:**
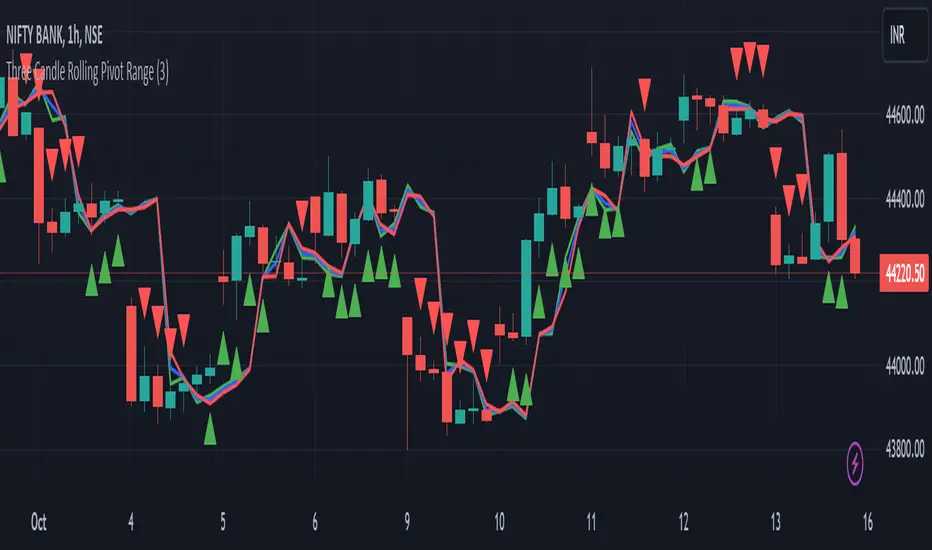
- **Plotting:**
- The rolling pivot range high, rolling pivot, and rolling pivot range low are plotted on the chart for visual reference.
- Long entry points are marked with a green triangle below the corresponding candle.
- Short entry points are marked with a red triangle above the corresponding candle.
**Conclusion:**
This strategy leverages the rolling pivot range to identify potential reversal points in the market. By considering the relative position of the current price compared to the dynamic support and resistance levels, the strategy aims to capture favorable trading opportunities. However, like all trading strategies, it should be used cautiously and backtested thoroughly on historical data to ensure its effectiveness before implementation in a live trading environment. Additionally, risk management techniques should always be applied to safeguard trading capital.
نص برمجي مفتوح المصدر
بروح TradingView الحقيقية، قام مبتكر هذا النص البرمجي بجعله مفتوح المصدر، بحيث يمكن للمتداولين مراجعة وظائفه والتحقق منها. شكرا للمؤلف! بينما يمكنك استخدامه مجانًا، تذكر أن إعادة نشر الكود يخضع لقواعد الموقع الخاصة بنا.
إخلاء المسؤولية
لا يُقصد بالمعلومات والمنشورات أن تكون، أو تشكل، أي نصيحة مالية أو استثمارية أو تجارية أو أنواع أخرى من النصائح أو التوصيات المقدمة أو المعتمدة من TradingView. اقرأ المزيد في شروط الاستخدام.