OPEN-SOURCE SCRIPT
Extended Support and Resistance Levels

Indicator: Extended Support and Resistance Levels
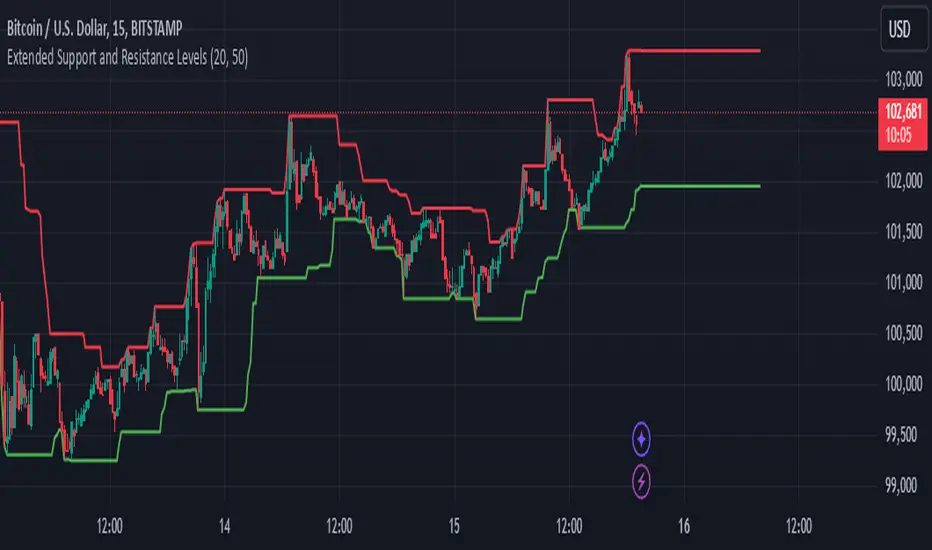
This Pine Script indicator dynamically calculates support and resistance levels based on recent price action and projects these levels into the future.
Support is determined by the lowest low over a user-defined period, while Resistance is defined by the highest high over the same period.
The indicator draws lines at the calculated support and resistance levels and extends them into the future, allowing traders to visualize potential future levels where price might react.
The extension of these lines helps in identifying areas where price may respect support or resistance in the upcoming bars.
The user can adjust the period for support/resistance calculation and the number of bars for projection, providing flexibility to adapt to different timeframes and market conditions.
This tool is ideal for traders looking to anticipate future key price levels based on historical price data, helping with decision-making on potential entry or exit points.
نص برمجي مفتوح المصدر
بروح TradingView الحقيقية، قام مبتكر هذا النص البرمجي بجعله مفتوح المصدر، بحيث يمكن للمتداولين مراجعة وظائفه والتحقق منها. شكرا للمؤلف! بينما يمكنك استخدامه مجانًا، تذكر أن إعادة نشر الكود يخضع لقواعد الموقع الخاصة بنا.
إخلاء المسؤولية
لا يُقصد بالمعلومات والمنشورات أن تكون، أو تشكل، أي نصيحة مالية أو استثمارية أو تجارية أو أنواع أخرى من النصائح أو التوصيات المقدمة أو المعتمدة من TradingView. اقرأ المزيد في شروط الاستخدام.