OPEN-SOURCE SCRIPT
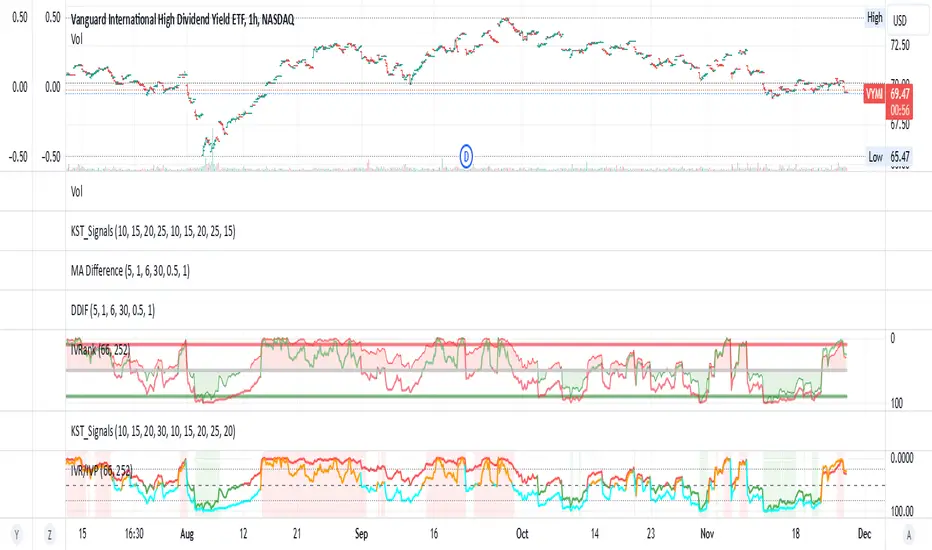
IV Rank/Percentile with Williams VIX Fix

Display IV Rank / IV Percentile
This indicator is based on William's VixFix, which replicates the VIX—a measure of the implied volatility of the S&P 500 Index (SPX). The key advantage of the VixFix is that it can be applied to any security, not just the SPX.
IV Rank is calculated by identifying the highest and lowest implied volatility (IV) values over a selected number of past periods. It then determines where the current IV lies as a percentage between these two extremes. For example, if over the past five periods the highest IV was 30%, the lowest was 10%, and the current IV is 20%, the IV Rank would be 50%, since 20% is halfway between 10% and 30%.
IV Percentile, on the other hand, considers all past IV values—not just the highest and lowest—and calculates the percentage of these values that are below the current IV. For instance, if the past five IV values were 30%, 10%, 11%, 15%, and 17%, and the current IV is 20%, the IV Rank remains at 50%. However, the IV Percentile is 80% because 4 out of the 5 past values (80%) are below the current IV of 20%.
نص برمجي مفتوح المصدر
بروح TradingView الحقيقية، قام مبتكر هذا النص البرمجي بجعله مفتوح المصدر، بحيث يمكن للمتداولين مراجعة وظائفه والتحقق منها. شكرا للمؤلف! بينما يمكنك استخدامه مجانًا، تذكر أن إعادة نشر الكود يخضع لقواعد الموقع الخاصة بنا.
إخلاء المسؤولية
لا يُقصد بالمعلومات والمنشورات أن تكون، أو تشكل، أي نصيحة مالية أو استثمارية أو تجارية أو أنواع أخرى من النصائح أو التوصيات المقدمة أو المعتمدة من TradingView. اقرأ المزيد في شروط الاستخدام.