OPEN-SOURCE SCRIPT
تم تحديثه Day Trader's Anchored Moving Averages [wbburgin]
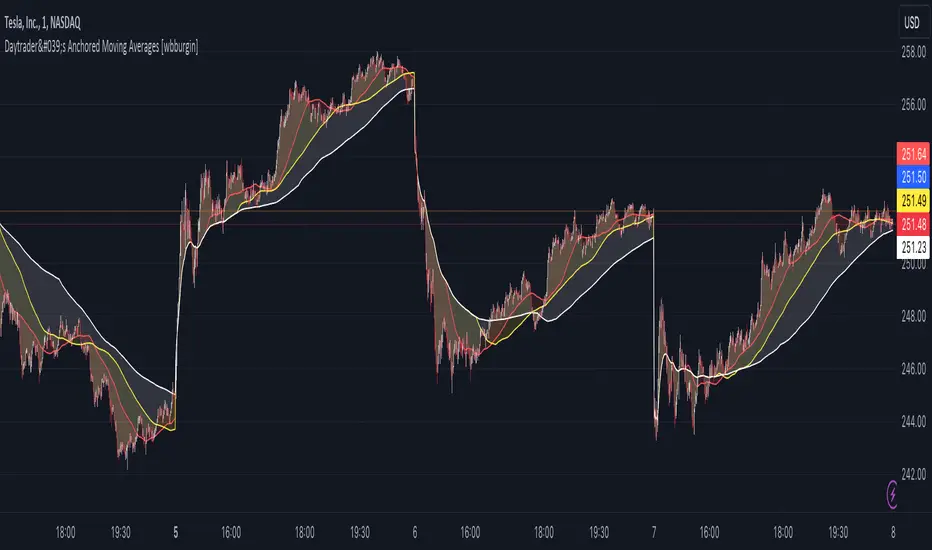
For day traders, establishing a trend at the start of the day is critically important for setting targets and entering positions. This can be difficult when traditional moving averages lag from previous days, causing late entry and/or incorrect trend interpretation.
The Day Trader's Anchored MA indicator plots three dynamic moving averages which restart on each new period (session [daily] or monthly - more coming soon). This eliminates the lag in traditional moving averages while better identifying the trend, as the moving averages essentially 'build up' their lengths as the day progresses, until they reach your chosen maximum length.
This means that these anchored moving averages are
Quick usage note: make sure that your moving average length is less than the number of bars in the period, or it won't reach the maximum length you specified.
TL;DR: Moving average that resets every day and does not lag. Inspired by the VWAP.
The Day Trader's Anchored MA indicator plots three dynamic moving averages which restart on each new period (session [daily] or monthly - more coming soon). This eliminates the lag in traditional moving averages while better identifying the trend, as the moving averages essentially 'build up' their lengths as the day progresses, until they reach your chosen maximum length.
This means that these anchored moving averages are
- Quicker to identify the start-of-day trend, as markets tend to establish and then follow one trend throughout the day;
- Dynamically increasing throughout the day (to your specifications)
- Completely independent from previous days
Quick usage note: make sure that your moving average length is less than the number of bars in the period, or it won't reach the maximum length you specified.
TL;DR: Moving average that resets every day and does not lag. Inspired by the VWAP.
ملاحظات الأخبار
Changed spacing of name slightly.ملاحظات الأخبار
Removed unnecessary code.نص برمجي مفتوح المصدر
بروح TradingView الحقيقية، قام مبتكر هذا النص البرمجي بجعله مفتوح المصدر، بحيث يمكن للمتداولين مراجعة وظائفه والتحقق منها. شكرا للمؤلف! بينما يمكنك استخدامه مجانًا، تذكر أن إعادة نشر الكود يخضع لقواعد الموقع الخاصة بنا.
FAQ: I am gradually phasing out my Patreon because of the time it takes to maintain.
BTC: 35PdMMMXFCvPjXKwn8wsRFNwMEPgStaKUJ
Test my strategies on CryptoRobotics: cryptorobotics.co/?trade=f23b09
BTC: 35PdMMMXFCvPjXKwn8wsRFNwMEPgStaKUJ
Test my strategies on CryptoRobotics: cryptorobotics.co/?trade=f23b09
إخلاء المسؤولية
لا يُقصد بالمعلومات والمنشورات أن تكون، أو تشكل، أي نصيحة مالية أو استثمارية أو تجارية أو أنواع أخرى من النصائح أو التوصيات المقدمة أو المعتمدة من TradingView. اقرأ المزيد في شروط الاستخدام.
نص برمجي مفتوح المصدر
بروح TradingView الحقيقية، قام مبتكر هذا النص البرمجي بجعله مفتوح المصدر، بحيث يمكن للمتداولين مراجعة وظائفه والتحقق منها. شكرا للمؤلف! بينما يمكنك استخدامه مجانًا، تذكر أن إعادة نشر الكود يخضع لقواعد الموقع الخاصة بنا.
FAQ: I am gradually phasing out my Patreon because of the time it takes to maintain.
BTC: 35PdMMMXFCvPjXKwn8wsRFNwMEPgStaKUJ
Test my strategies on CryptoRobotics: cryptorobotics.co/?trade=f23b09
BTC: 35PdMMMXFCvPjXKwn8wsRFNwMEPgStaKUJ
Test my strategies on CryptoRobotics: cryptorobotics.co/?trade=f23b09
إخلاء المسؤولية
لا يُقصد بالمعلومات والمنشورات أن تكون، أو تشكل، أي نصيحة مالية أو استثمارية أو تجارية أو أنواع أخرى من النصائح أو التوصيات المقدمة أو المعتمدة من TradingView. اقرأ المزيد في شروط الاستخدام.