OPEN-SOURCE SCRIPT
تم تحديثه Daily Range

Hey traders,
at first thanks to the one and only Master Educator Stefan Kassing for sharing his legendary system with us!
And also credit to Mortdiggiddy, RootDuk and PineCoders for helping me with the script =)
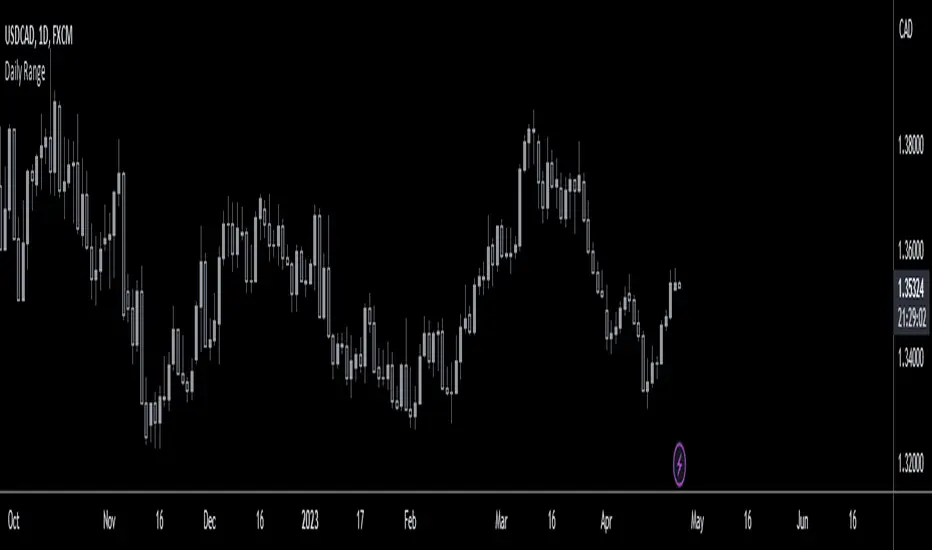
This script is calculating the daily range (in pips) of the current market you are in, in relation to the last 70 days (10 weeks).
It is used for a possible Take Profit in Stefan Kassing's System.
How to add the script to your chart:
1. Click "Add to Favorite Scripts"
-> i.imgur.com/DyGPaBz.png
2. Go in the Chart & click the little arrow in the upper bar and then click "Daily Range", then the Daily Range appears in the top left corner
-> i.imgur.com/fFl3W28.png
To avoid errors make sure to right-click the Y-Axis on the right side of the chart and then left-click "Scale Price Chart Only".
-> i.imgur.com/2UVA86u.png
Also be aware that the daily range is only showing up, if you are in the daily time interval or below and you are not hovering with the cursor over the past candles respectively above or below them.
If you are using this script in exotic currencypairs or uncommon other markets, the daily range can be incorrect or not showing up.
So don't hesitate contacting me, then I will try to add the markets that you want to.
To change the color or the decimal places of the number, you can click the gear in the upper left corner.
-> i.imgur.com/FA6Su7h.png
Happy Pips
ملاحظات الأخبار
The calculation is done in relation to the last 50 days, not 70 daysملاحظات الأخبار
Fixed the calculation with crypto currenciesملاحظات الأخبار
- Changed the script to PineScript version 5- Changed the calculation of the Daily Range
- Added an input field that allows the user to modify the number of days used in the calculation of the Daily Range (the default is 50)
If there are any issues with this version, and you have improvement suggestions, please let me know.
نص برمجي مفتوح المصدر
بروح TradingView الحقيقية، قام مبتكر هذا النص البرمجي بجعله مفتوح المصدر، بحيث يمكن للمتداولين مراجعة وظائفه والتحقق منها. شكرا للمؤلف! بينما يمكنك استخدامه مجانًا، تذكر أن إعادة نشر الكود يخضع لقواعد الموقع الخاصة بنا.
إخلاء المسؤولية
لا يُقصد بالمعلومات والمنشورات أن تكون، أو تشكل، أي نصيحة مالية أو استثمارية أو تجارية أو أنواع أخرى من النصائح أو التوصيات المقدمة أو المعتمدة من TradingView. اقرأ المزيد في شروط الاستخدام.