OPEN-SOURCE SCRIPT
Composite RSI [KFB Quant]
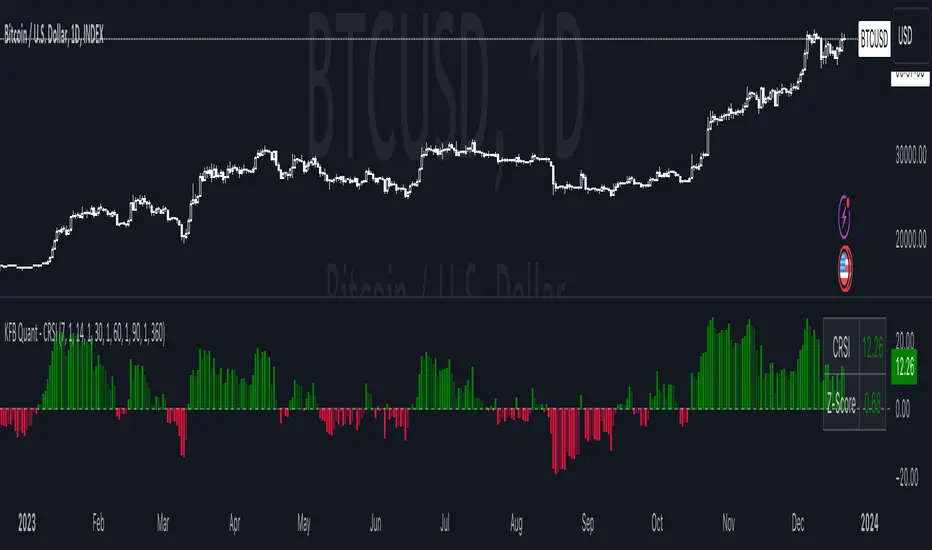
The Composite RSI (CRSI) is a momentum oscillator that combines 5 adjustable RSI's. It also has a Z-Score to make it easier to identify potential market extremes.
How to adjust the indicator
How to adjust the indicator
- Inside the Length & Impact Configuration tab you can adjust the length and impact of each RSI as well as the Z-Score length specific to your needs. The default length inputs are 7, 14, 30, 60, 90 (RSI 1 - RSI 5) and the default impact is set to 1.0 for all RSI's. Default length for Z-Score is 360.
- Inside the Style Configuration tab you can pick what you want to display(plot). The options are: CRSI, Z-Score, Overview Table and the individual RSI's.
- Inside the Color Configuration tab you can customize the color of each plot.
How the script worksCRSI = rsi_sum / imp_sumZ-Score = (crsi - crsi_mean) / crsi_stdev - rsi_sum = (rsi_1 -50) + (rsi_2 -50) + (rsi_3 -50) + (rsi_4 -50) + (rsi_5 -50)
- imp_sum = imp_1 + imp_2 + imp_3 + imp_4 + imp_5
- crsi_mean = Average of the crsi over the defined period in Z-Score Length
- crsi_stdev = StDev of crsi over the defined period in Z-Score Length
This is not financial advice. Trading is risky & most traders lose money. Past performance does not guarantee future results. This indicator is for informational & educational purposes only.
نص برمجي مفتوح المصدر
بروح TradingView الحقيقية، قام مبتكر هذا النص البرمجي بجعله مفتوح المصدر، بحيث يمكن للمتداولين مراجعة وظائفه والتحقق منها. شكرا للمؤلف! بينما يمكنك استخدامه مجانًا، تذكر أن إعادة نشر الكود يخضع لقواعد الموقع الخاصة بنا.
إخلاء المسؤولية
لا يُقصد بالمعلومات والمنشورات أن تكون، أو تشكل، أي نصيحة مالية أو استثمارية أو تجارية أو أنواع أخرى من النصائح أو التوصيات المقدمة أو المعتمدة من TradingView. اقرأ المزيد في شروط الاستخدام.